Gold Price Forecast: XAUUSD eyes $1,728 and $1,730 on the road to recovery – Confluence Detector
- Gold Price holds the recovery from 11-month highs, as the US dollar corrects further.
- US Treasury yields tick higher amid risk flows, light economic calendar.
- XAUUSD sees more upside amid easing aggressive Fed tightening expectations.
Gold Price has staged an impressive bounce from near 11-month lows of $1,698, as the US dollar is on an extending corrective decline amid a risk-on market profile and easing fears over aggressive Fed tightening expectations. Markets are back to pricing a 75 bps July Fed rate hike after Friday’s UoM Inflation expectations gauge dipped to 2.8%. A less aggressive Fed rate hike path could help the US economy skirt a recession. Meanwhile, China announced policy measures to support the property sector as well as to stimulate economic growth. Investors continue to cheer a better market mood, adding to the pain in the safe-haven dollar. XAUUSD price will remain at the mercy of the broader market sentiment amid the Fed’s ‘blackout” period.
Also read: Gold Price Forecast: XAUUSD could face stiff resistance at $1,730 on the renewed upside
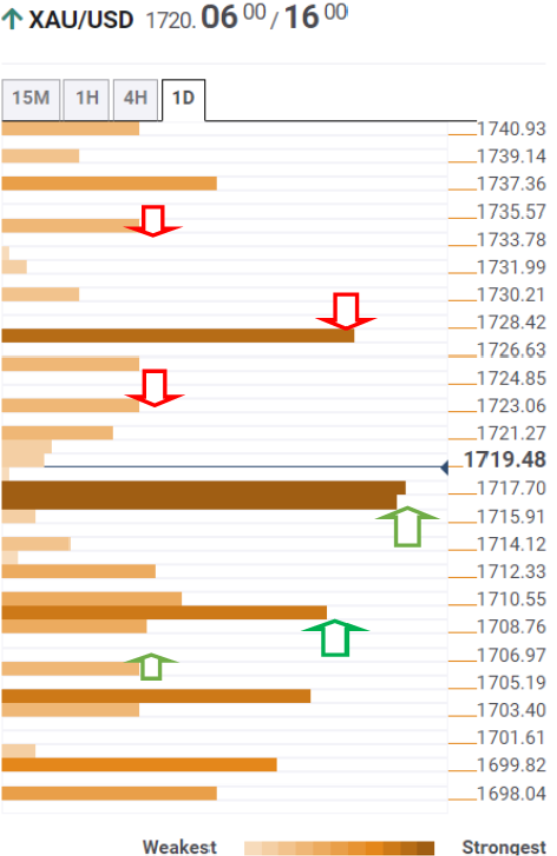
Gold Price: Key levels to watch
The Technical Confluence Detector shows that Gold Price sees the immediate upside barrier at the SMA 5 one-day at $1,723, above which the pivot point one-day R2 at $1,725 will get tested.
Buyers need acceptance above the convergence of the Fibonacci 161.8% one-day and Fibonacci 61.8% one-week at $1,728. The pivot point one-day R3 at $1,734 will be the last line of defense for XAU sellers.
Alternatively, a sustained move below the powerful cluster of support levels around $1,716 will fizzle out the recovery momentum. That level is the confluence of the previous day’s high, Fibonacci 38.2% one-week and pivot point one-day R1.
The next support awaits at the intersection of the Fibonacci 23.6% one-week and the SMA10 four-hour. The Fibonacci 38.2% one-day at $1,706 will be next on the sellers’ radars.
Here is how it looks on the tool
About Technical Confluences Detector
The TCD (Technical Confluences Detector) is a tool to locate and point out those price levels where there is a congestion of indicators, moving averages, Fibonacci levels, Pivot Points, etc. If you are a short-term trader, you will find entry points for counter-trend strategies and hunt a few points at a time. If you are a medium-to-long-term trader, this tool will allow you to know in advance the price levels where a medium-to-long-term trend may stop and rest, where to unwind positions, or where to increase your position size.