Back
7 Jul 2022
US Dollar Index Price Analysis: Technical correction could extend to 105.80.
- DXY retreats from recent cycle tops near 107.30 (July 7).
- Overbought conditions spark the current technical drop.
DXY comes under selling pressure following four consecutive daily advances and revisits the sub-107.00 area on Thursday.
Further upside in the dollar remains in store in the short-term horizon, however. Against that, the index could now look to revisit the December 2002 top at 107.31 ahead of the October 2002 high at 108.74.
As long as the 4-month line near 102.60 holds the downside, the near-term outlook for the index should remain constructive.
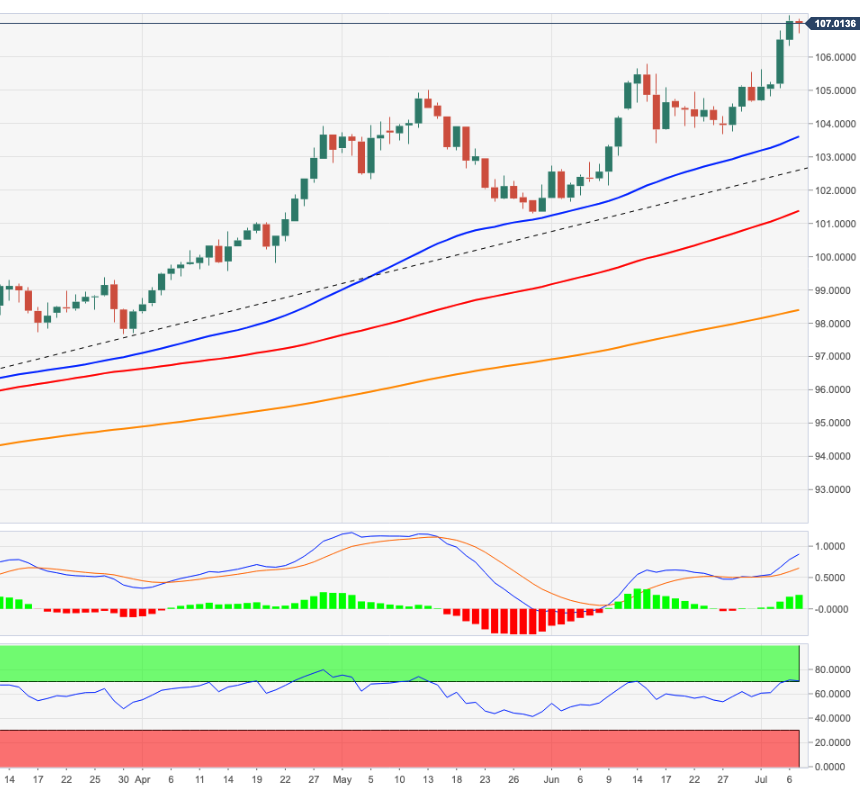
In addition, the broader bullish view remains in place while above the 200-day SMA at 98.39.
Of note, however, is that the index trades in the overbought territory and it therefore could extend the corrective decline to, initially, the 105.80 region (high June 15).
DXY daily chart