WTI Price Analysis: Buyers return from $102.60 support confluence
- WTI reverses Friday’s pullback from one-week high with mild gains inside a bullish chart pattern.
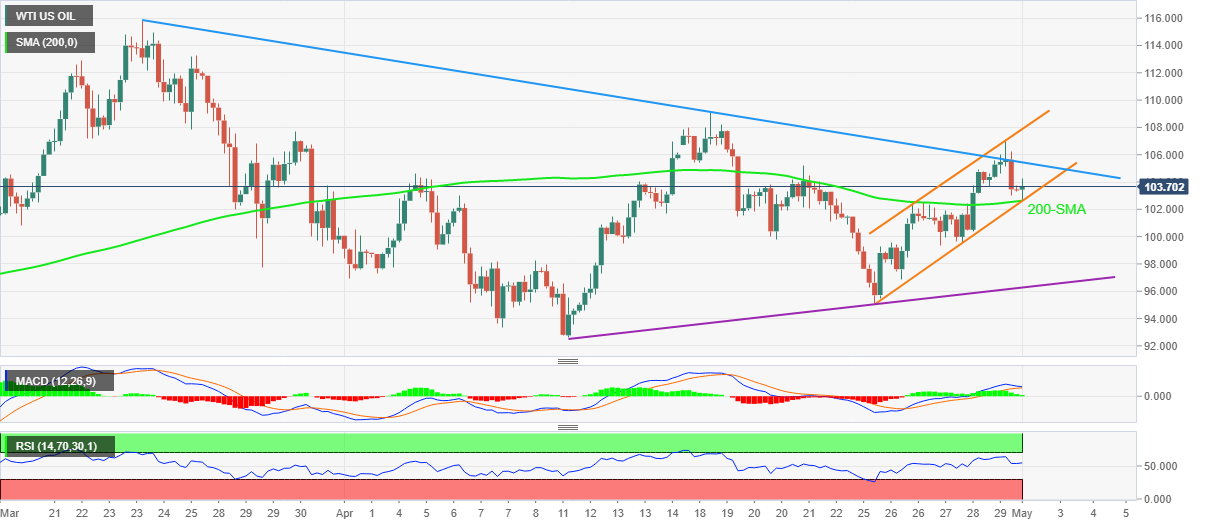
- 200-SMA, support line of the rising channel restrict short-term downside amid firmer RSI.
- Five-week-old resistance line guards recovery moves, MACD signals easing bullish bias.
WTI bounces off short-term key support while reversing the previous day’s U-turn from the monthly hurdle. That said, the black gold prints half a percent of intraday gains as buyers attack $104.00 during Monday’s Asian session.
In doing so, the energy benchmark takes a U-turn from the convergence of the 200-SMA and the lower line of the one-week-long rising channel. Also favoring the buyers is the firm RSI condition (14), currently around 55.00.
The recovery moves currently aim for another battle with the downward sloping resistance line from late March, near $105.45 by the press time.
Following that, the upper line of the stated channel and the monthly peak, respectively around $107.90 and $109.15, will be on the WTI bull’s radars.
Alternatively, WTI sellers will wait for a clear downside break of the $102.60 support confluence for fresh entry.
Even so, an ascending support line from April 11, at $96.30 by the press time, will add to the downside filters before directing bears towards the monthly low of $92.64.
WTI: Four-hour chart
Trend: Recovery expected