GBP/USD Price Analysis: Hovers around 10-week high on the way to 1.3700
- GBP/USD bulls take a breather around multi-day top after rising the most in a fortnight.
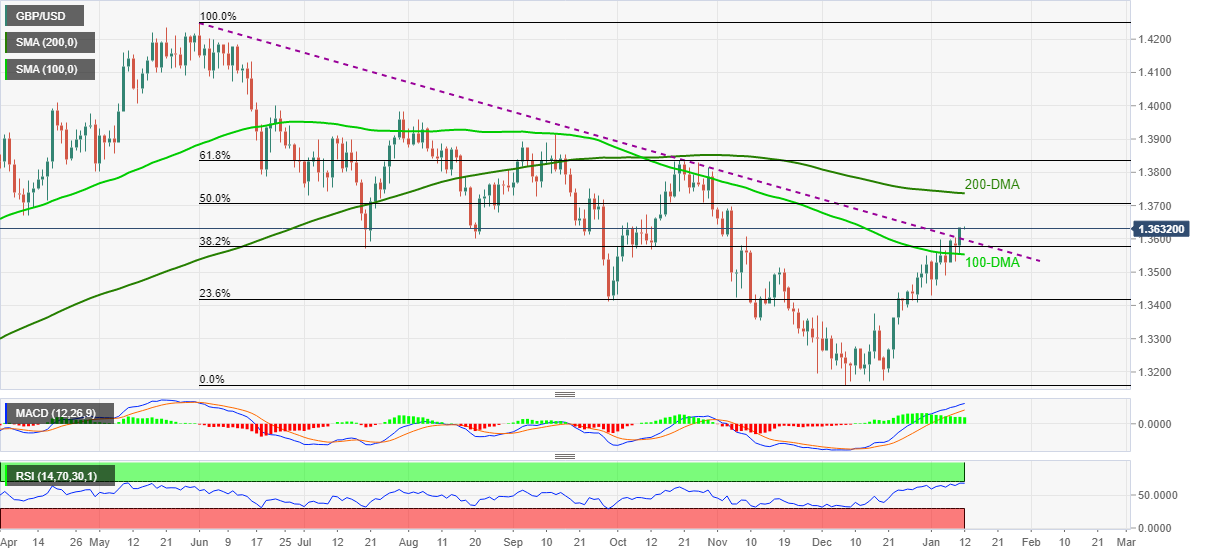
- Clear break of the descending trend line from June joins bullish MACD signals to keep buyers hopeful.
- Overbought RSI tests further advances but 100-DMA adds to the immediate challenges for sellers.
GBP/USD seesaws near November highs after crossing the key resistance line to refresh multi-day peak the previous day. That said, the cable pair makes rounds to 1.3630-35 during the initial Asian session on Wednesday.
Although nearly overbought RSI challenges the pair buyers, a clear upside break of the seven-month-old resistance line, now support around 1.3595, hints at the pair’s further advances.
Even if the pullback move recalls the 1.3595, the 100-DMA level of 1.3550 and November 18 swing high near 1.3515 will challenge the GBP/USD sellers.
Should the quote drops below 1.3515, the 23.6% Fibonacci retracement (Fibo.) of June-December downside, near 1.3415, should return to the chart.
Alternatively, GBP/USD buyers are up for challenging the 50% Fibo. level surrounding the 1.3700 threshold. Though, the 200-DMA near 1.3740 will test the quote’s additional run-up.
Also acting as the upside filter is the 61.8% Fibonacci retracement level of 1.3835.
GBP/USD: Daily chart
Trend: Further upside expected