Palladium Price Analysis: XPD/USD directs nearby resistance breakout towards 200-EMA
- Palladium picks up bids, extends previous day’s break of weekly resistance line.
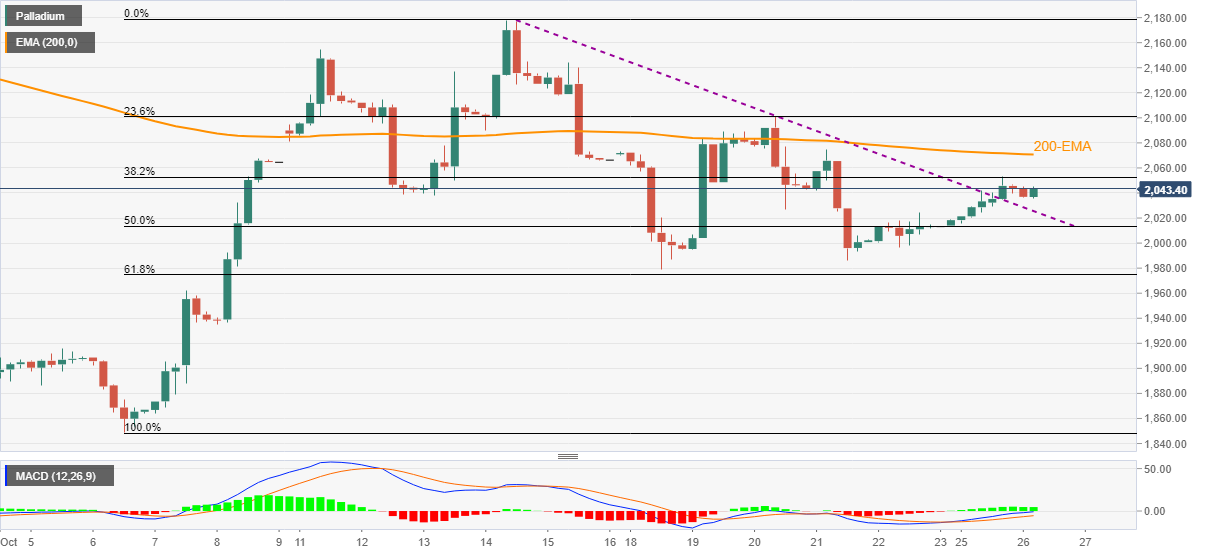
- Bullish MACD, sustained trading above 61.8% Fibonacci retracement favor buyers.
Palladium (XPD/USD) remains on the front foot around $2,045, up 0.18% intraday during the early European session on Tuesday.
The precious metal crossed a downward sloping trend line from October 14 the previous day. The same joins upbeat MACD signals to keep buyers hopeful.
However, a clear upside break of the 200-EMA, around $2,070 by the press time, becomes necessary for the commodity bulls before challenging the monthly peak of $2,176.
During the rise, the $2,100 threshold will become an intermediate halt.
Meanwhile, pullback moves remain less important until staying beyond the previous resistance line, close to $2,025 at the latest.
Also acting as a downside filter is the $2,000 psychological magnet and 61.8% Fibonacci retracement of the early October advances, near $1,974.
Overall, palladium prices are likely to extend recovery moves but a bumpy road ahead challenge the buyers.
Palladium: Four-hour chart
Trend: Further upside expected