Copper Price Analysis: Consolidates biggest daily losses in four months
- Copper struggles to extend the rebound from weekly low.
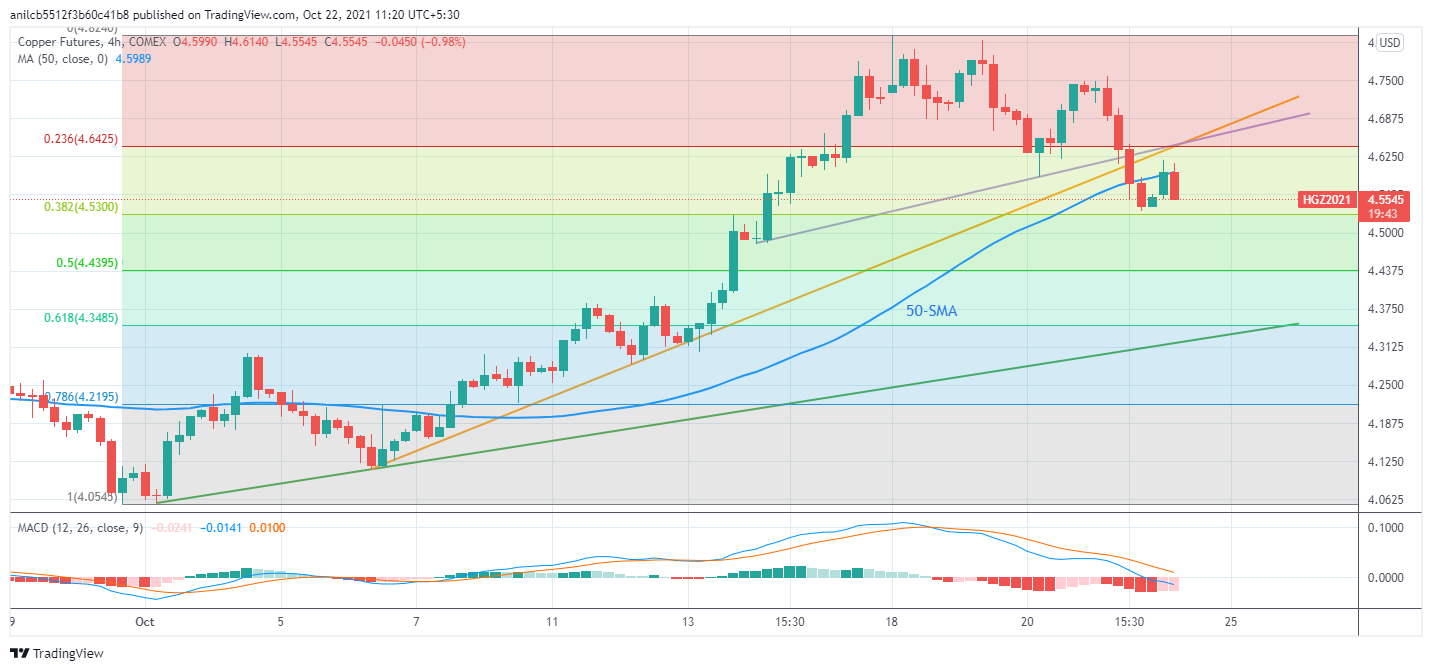
- 50-SMA, ascending trend line confluence challenge bulls, 38.2% Fibonacci retracement restrict immediate downside.
Copper retreats to $4.5835 while fading recovery moves from the weekly low as Friday’s European session begins.
In doing so, the red-metal steps back from 50-SMA level around $4.6000, also consolidating gains from 38.2% Fibonacci retracement (Fibo.) level of the monthly run-up.
Other than the $4.6000, a convergence of 23.6% Fibo. and ascending trend lines from October 14 and 06, around $4.6425-30, also challenge copper buyers.
Given the bull’s ability to cross the $4.6430 hurdle, the latest swing high near $4.7575 may probe the upside before highlighting the monthly peak of $4.8230.
Meanwhile, pullback moves may aim for a 38.2% Fibonacci retracement level of $4.5300 before October 12 tops near $4.3955 can return to the market’s attention.
Should copper sellers dominate past $4.3955, an ascending support line from the month’s start near $4.3170, will be in focus.
Overall, copper prices remain bullish but short-term pullback can’t be ruled out.
Price of copper: Four-hour chart
Trend: Further upside expected