Back
4 May 2020
US Dollar Index Price Analysis: Interim hurdle aligns at 100.49
- DXY is charting a bullish ‘outside day’ on Monday.
- Quite decent contention emerged in the 98.50 area so far.
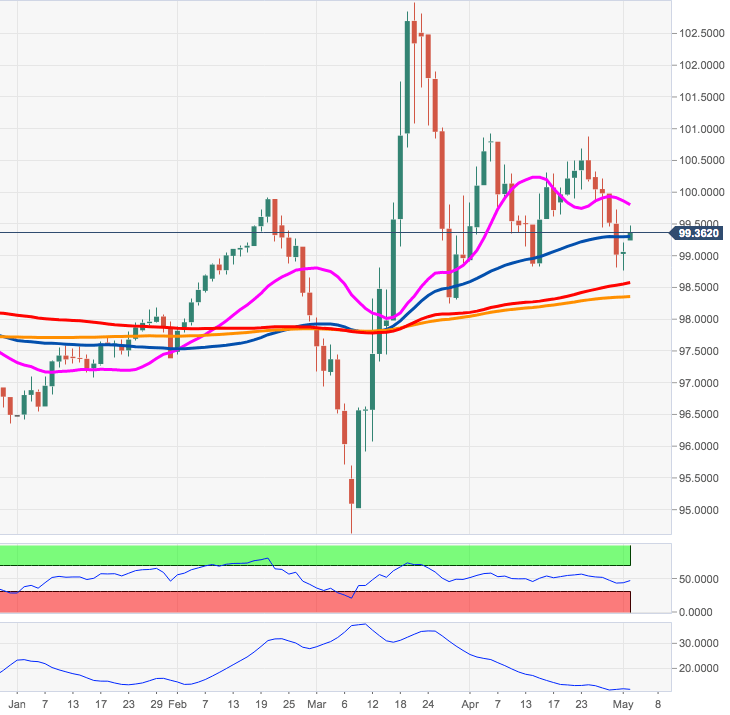
The recent downside momentum in DXY appears to have met moderate support in the 98.50 area for the time being.
If the recovery picks up further pace, then the focus of attention will shift to the Fibo retracement (of the 2017-2018 drop) at 100.49, ahead of the April’s top just below 101.00 the figure.
Further out, the 200-day SMA in the 98.30/35 band is expected to hold the downside in the short-term horizon.
DXY daily chart