NZD/USD Price Analysis: Buyers will look for entry beyond 0.6485/90
- NZD/USD stays on the back foot around the two-day low.
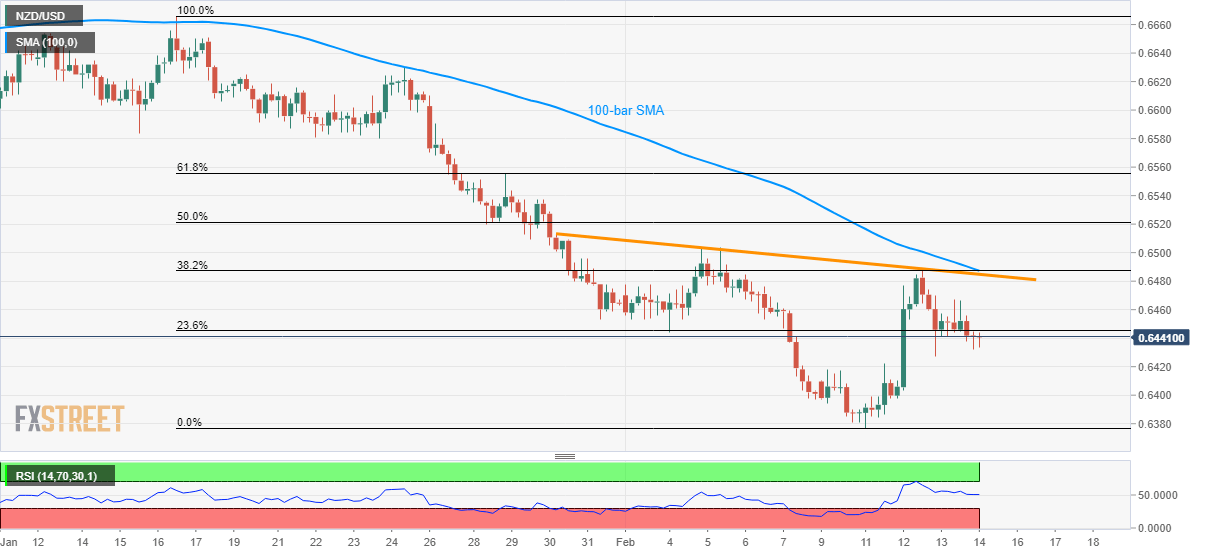
- The pair’s break of 23.6% Fibonacci retracement amid normal RSI conditions favor odds of further declines.
- 100-bar SMA, monthly descending trend line and 38.2% Fibonacci retracement question the bulls.
NZD/USD declines to 0.6440 during the early Asian session on Friday. The pair recently slipped below 23.6% Fibonacci retracement of January 16 to February 11 declines.
With the RSI also in the normal territory between 70 and 30, the quote is likely to extend the present declines towards multiple supports around 0.6420 and then to the monthly low around 0.6380.
If at all the bears keep dominating past-0.6380, November 2019 low near 0.6315 will return to the charts.
On the upside, 100-bar SMA, 38.2% Fibonacci retracement and a downward sloping trend line from January 30 together portray 0.6485/90 as the key resistance area.
Should prices cross the same, an inverse head-and-shoulders chart formation will be confirmed, which in turn will offer the pair’s rise towards 0.6600 round-figure.
However, the 61.8% Fibonacci retracement level of 0.6555 could question the bulls in the meantime.
NZD/USD four-hour chart
Trend: Bearish