Back
20 Jan 2020
USD/JPY London Price Forecast: Greenback sidelined above the 110.00 handle vs. yen
- USD/JPY is evolving in a rising wedge formation.
- Resistance is at 110.35 while support is seen at the 110.05 level.
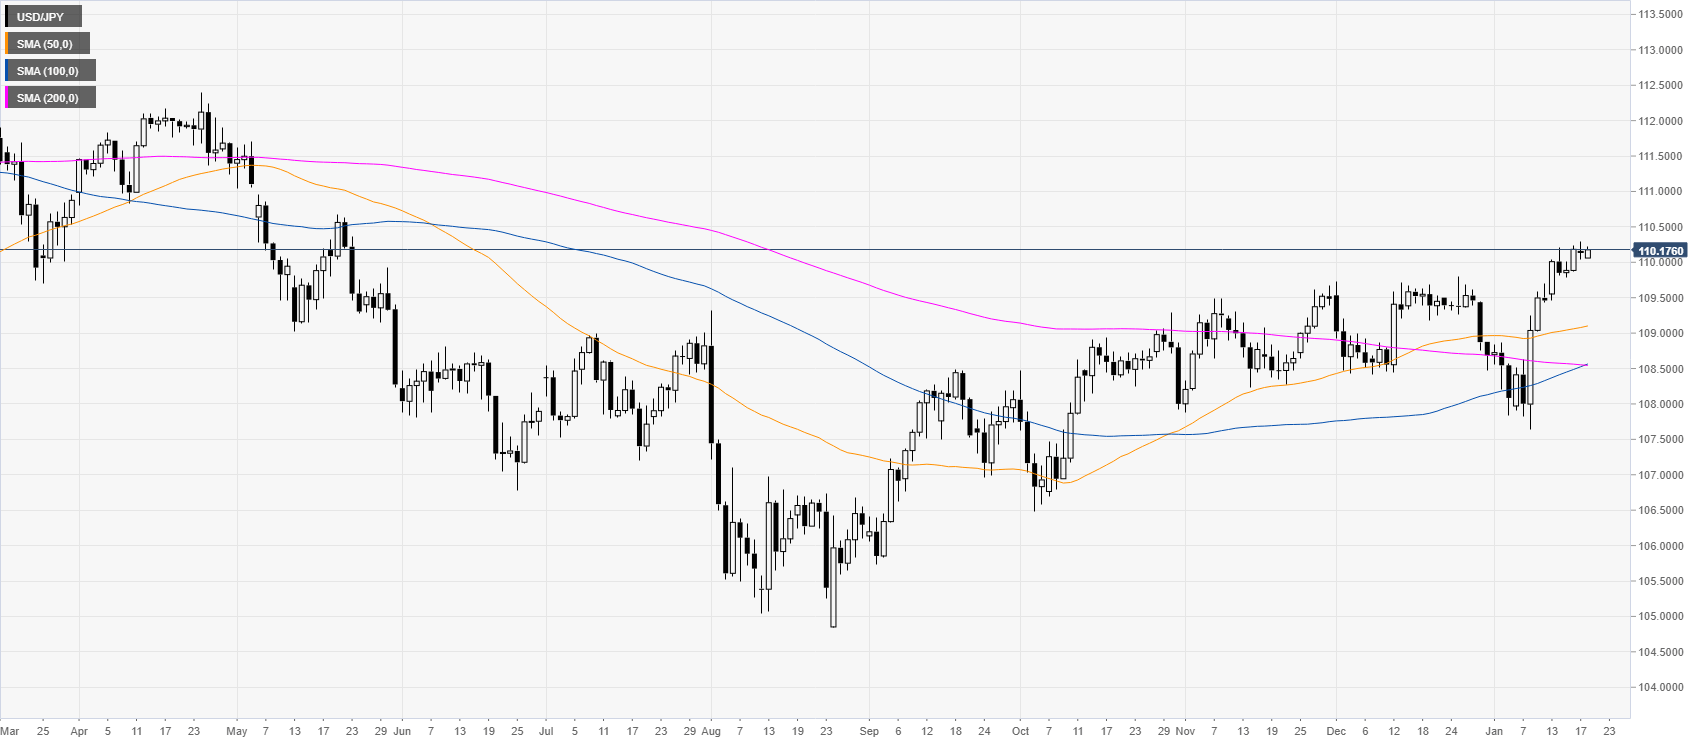
USD/JPY daily chart
USD/JPY is consolidating its January spike above the 110.00 handle and the main simple moving averages (SMAs). The market is trading near its highest since mid-May 2019.
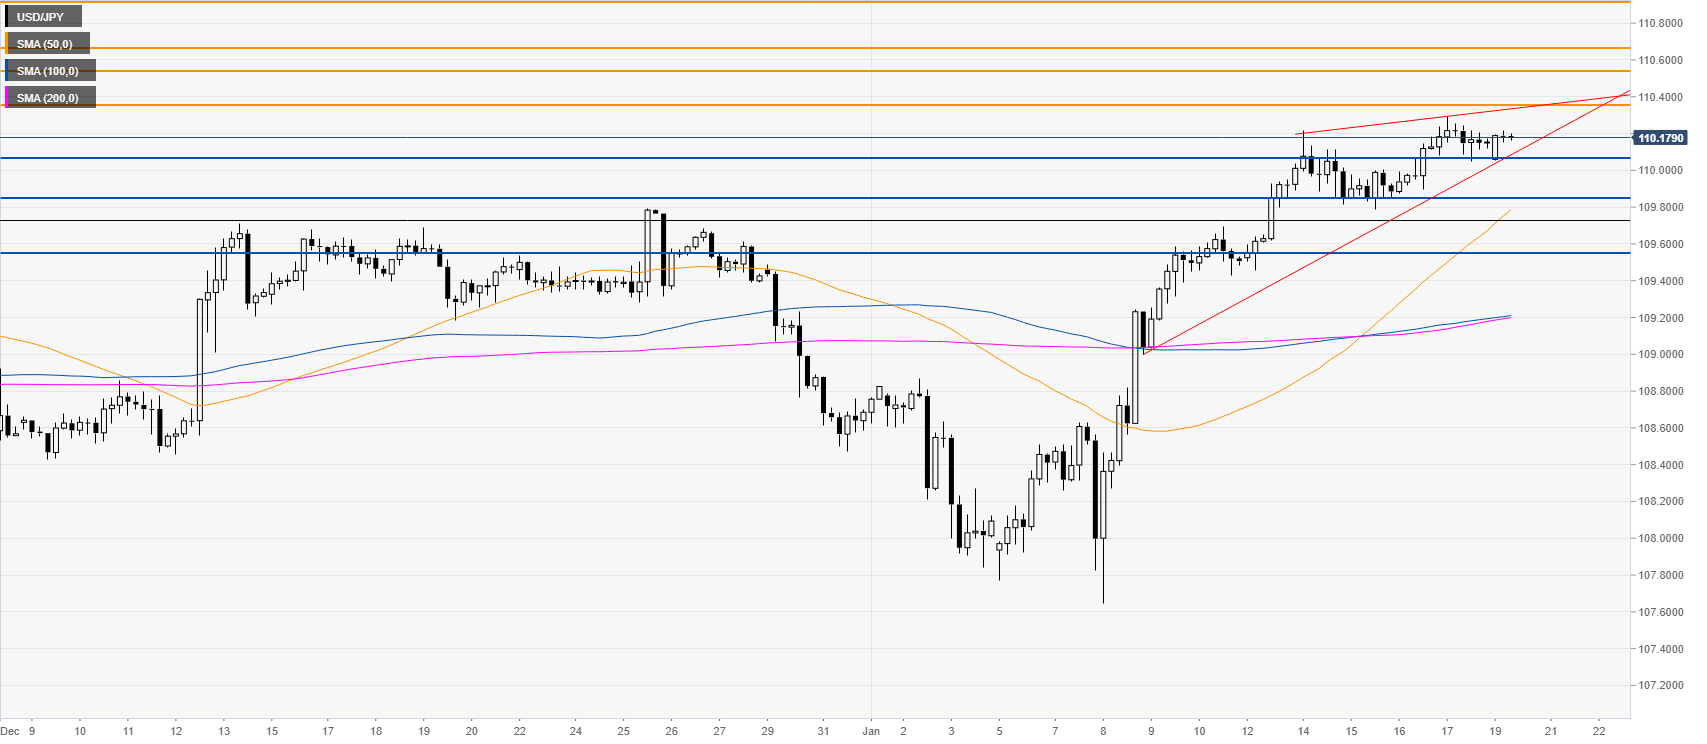
USD/JPY four-hour chart
USD/JPY is trading in a wedge-shaped pattern while above the main SMAs. If the bulls fail to regain the 110.35 level, the market can remain sideways with increasing odds for a potential down move. If the bears breach 110.05 support, the spot could decline towards the 109.85 and 109.55 levels, according to the Technical Confluences Indicator. On the flip side, a break above 110.35 can open the gates to 110.52 and 110.69.
Additional key levels