Back
10 Sep 2019
US Dollar Index technical analysis: DXY ends Tuesday just below 98.42 resistance level
- DXY (US Dollar Index) ends Tuesday virtually unchanged.
- The level to beat for buyers is at the 98.55 resistance level.
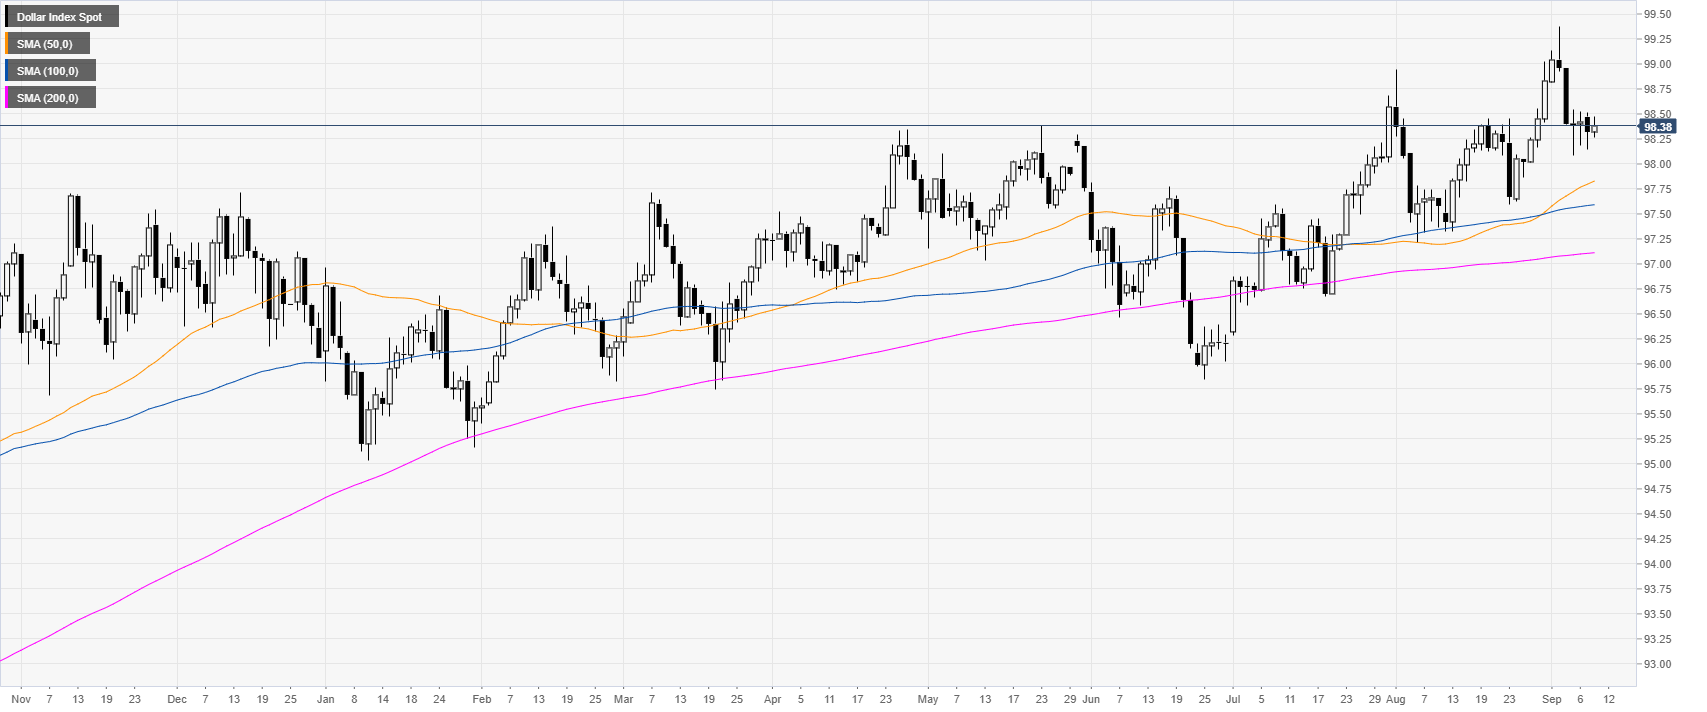
DXY daily chart
DXY (US Dollar Index) is trading in a bull trend above the main daily simple moving averages (DSMAs). The Greenback is ending Tuesday within familiar ranges in the 98.10/98.55 zone.

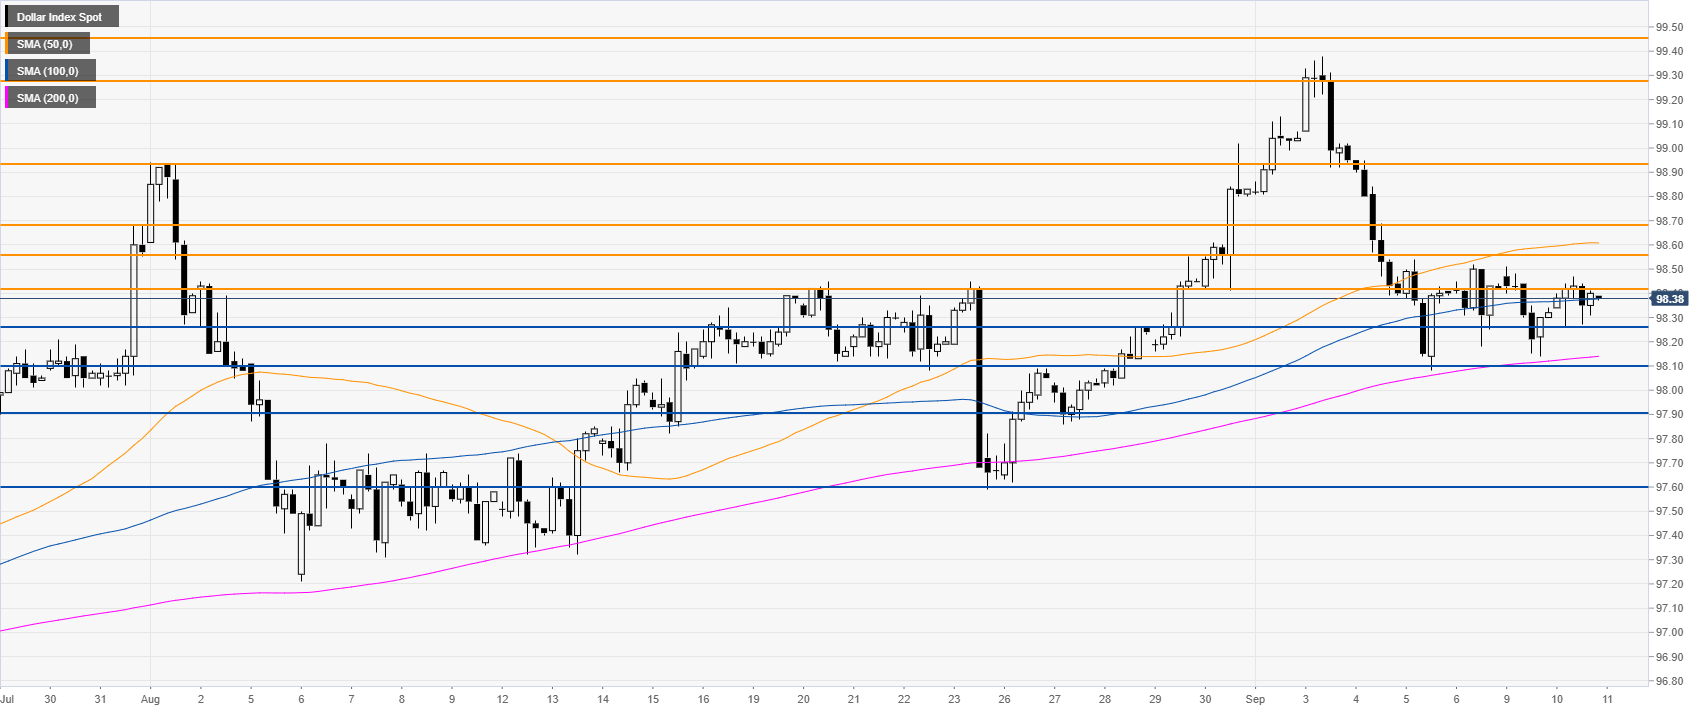
DXY four-hour chart
The US dollar Index is ending the day above 96.26 support and the 100/200 SMAs. The bull trend remains intact with DXY buyers looking for a break beyond 98.55 resistance. Further up, the 98.68 and 98.94 resistance levels can be next in line.

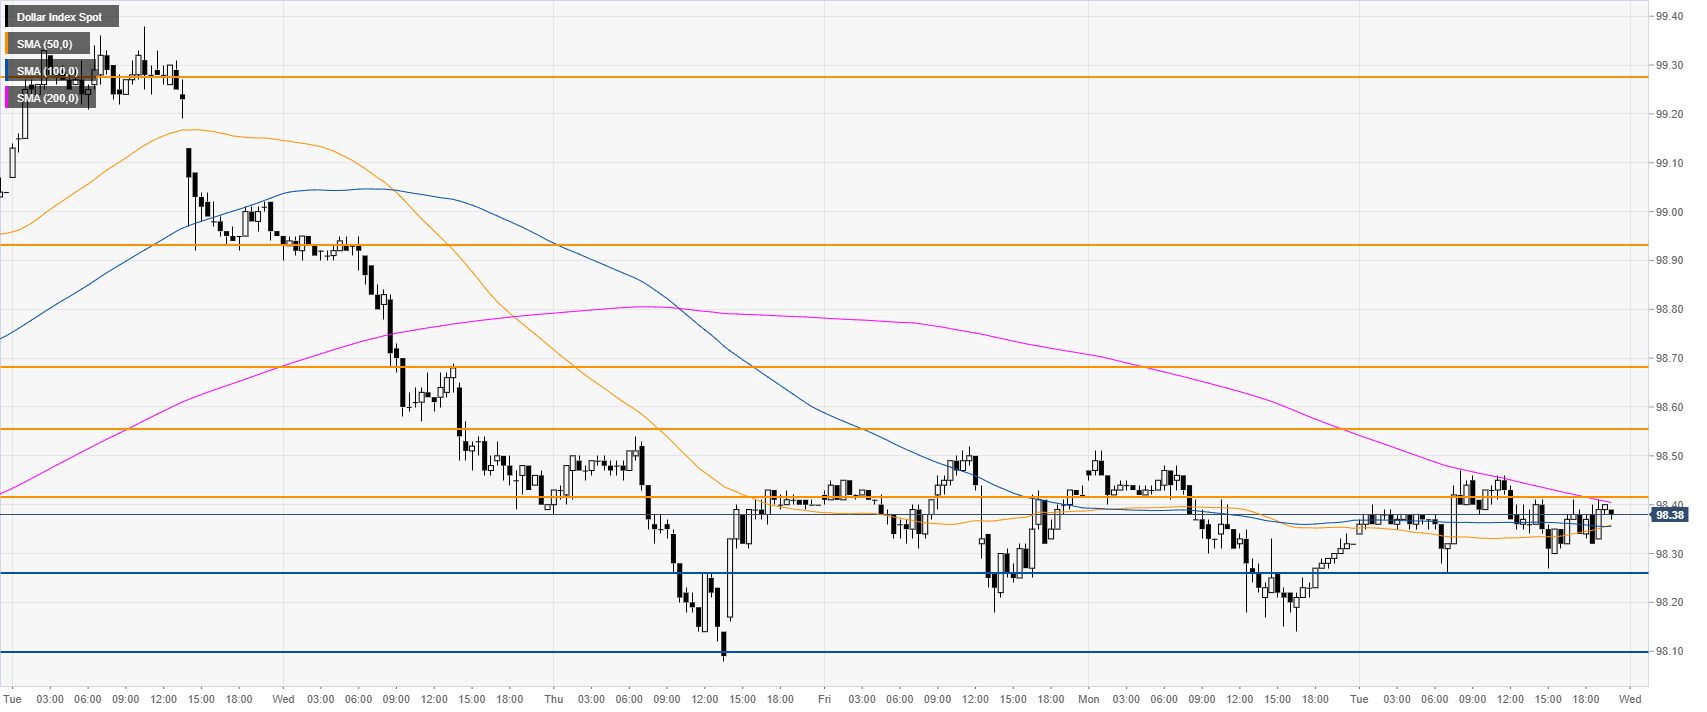
DXY 30-minute chart
DXY remains confined in a small range as the market is trading above flattening 50 and 100 SMAs. The 200 SMA is capping the upside. Immediate support is seen at the 98.26 and 98.10 price levels.

Additional key levels
