Back
9 Sep 2019
USD/JPY technical analysis: Doji on D1, failure to cross 50-DMA increase the odds of a pullback
- USD/JPY stays below 50-DMA with Doji on daily chart favoring a pullback.
- Two-week-old rising trend-line, 23.6% Fibonacci retracement become immediate support.
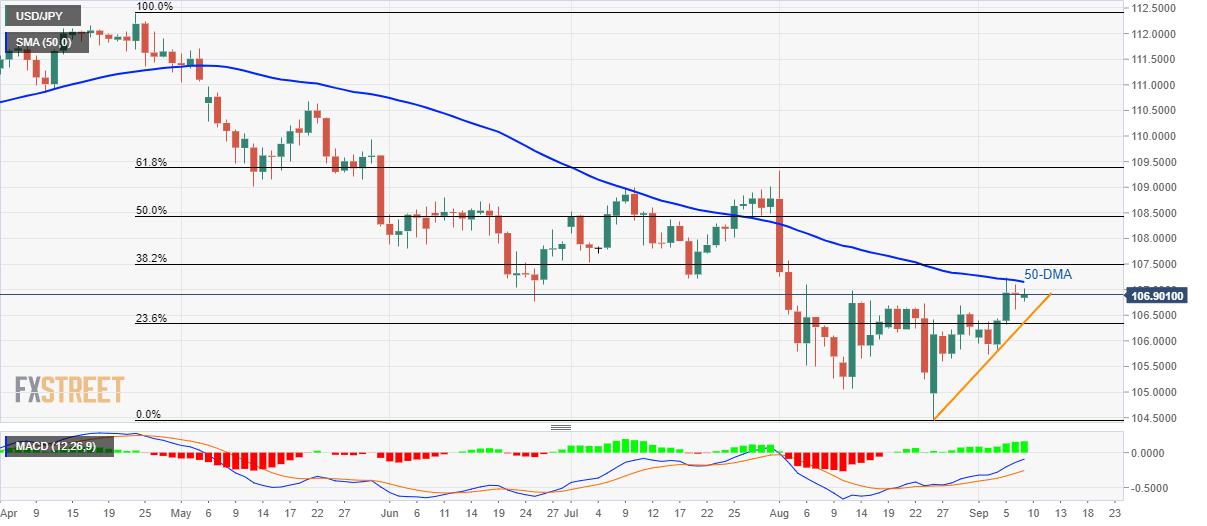
With its repeated failures to cross 50-day simple moving average (DMA) and a Doji candle on Friday, USD/JPY is likely witnessing pullbacks as it trades near 106.90 during early Monday.
In doing so, a two-week-old rising trend-line and 23.6% Fibonacci retracement of April-August declines, around 106.35/30, becomes an immediate support to watch.
Should prices decline below 106.30, 105.60 and August 12 low near 105.00 could be on the bears’ radar ahead of 104.45.
Meanwhile, an upside clearance of 50-DMA level of 107.15 will escalate the pair’s latest recovery towards early June low near 107.80.
Though, 50% Fibonacci retracement level of 108.45 and August month high close to 109.30 could please buyers then after.
USD/JPY daily chart
Trend: pullback expected