Back
26 Jul 2019
US Dollar Index technical analysis: DXY bulls en route towards the 2019 high
- DXY breaks above 97.80 opening the gates to the 2019 high.
- Support is seen at 97.80 and the 97.50 levels.
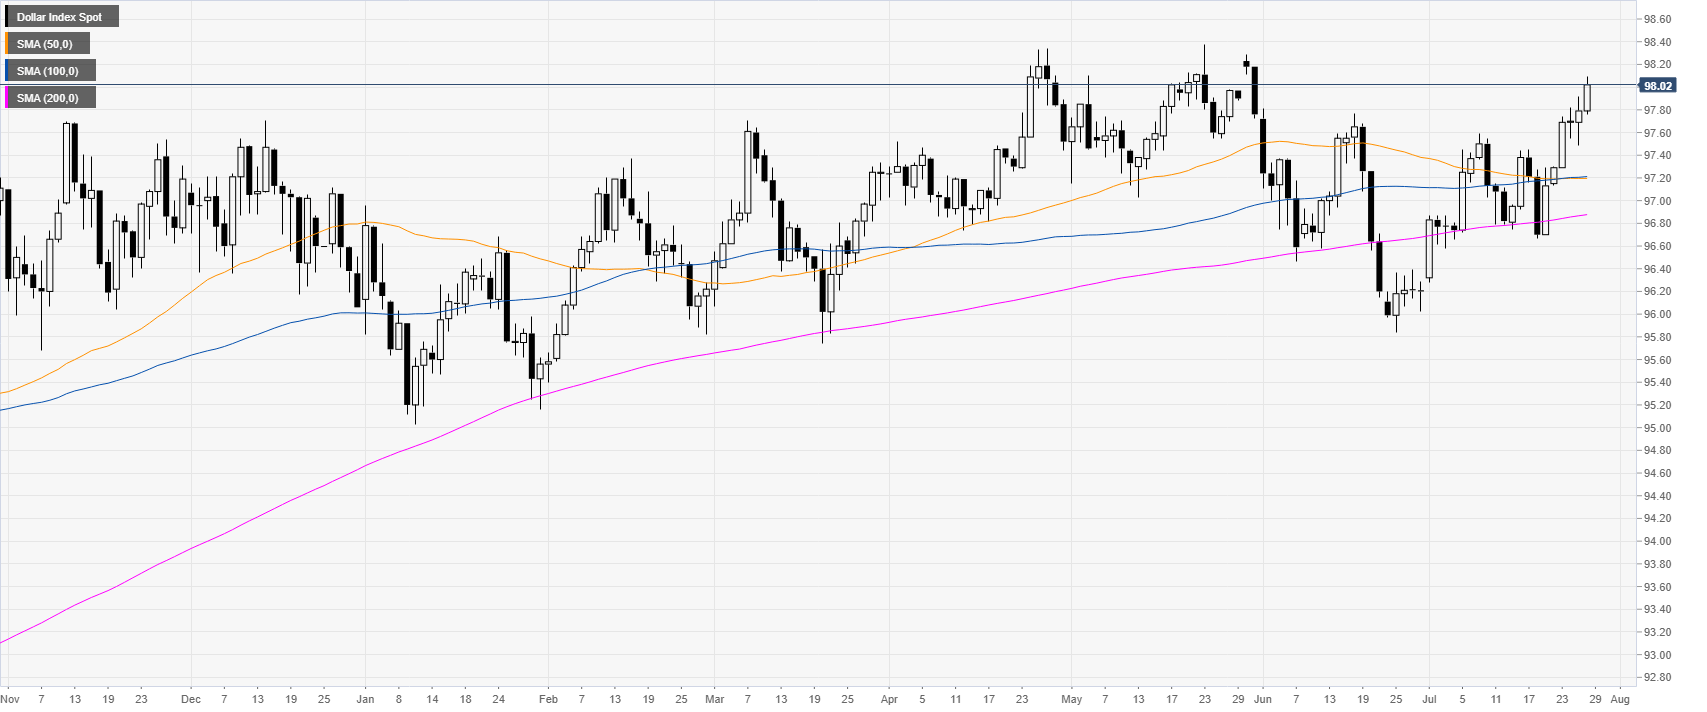
DXY daily chart
The market is trading in a bull trend above the main daily simple moving averages (DSMAs) as well as the 97.55 support.
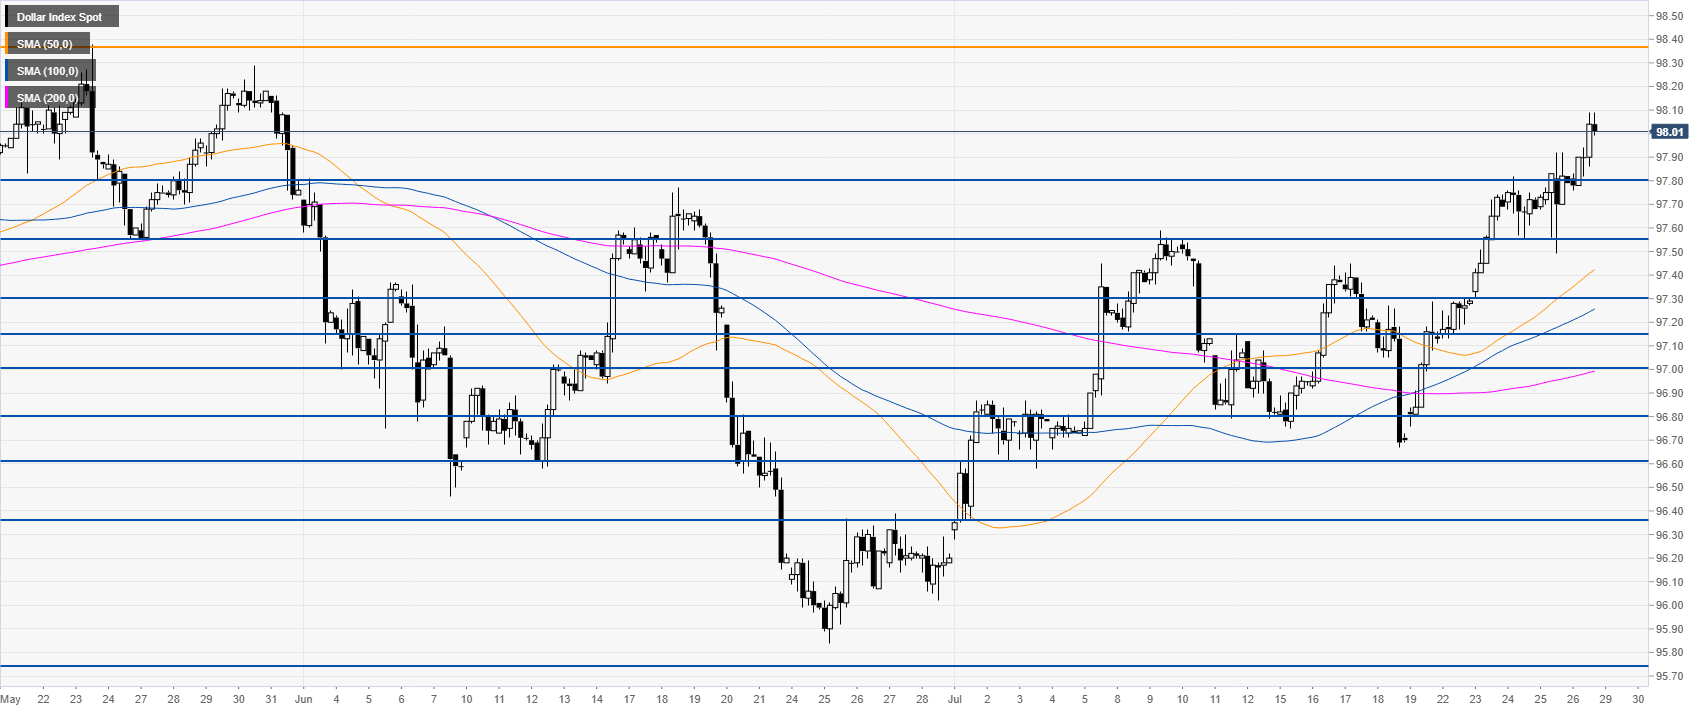
DXY 4-hour chart
DXY bulls broke above 97.80 resistance opening to door to 98.38, the 2019 high. Immediate support is seen at the 97.80 and 97.50 levels.
Additional key levels