Back
30 May 2019
US Dollar Index technical analysis: DXY ends the day virtually unchanged
- DXY erased most of its intraday gains this Thursday.
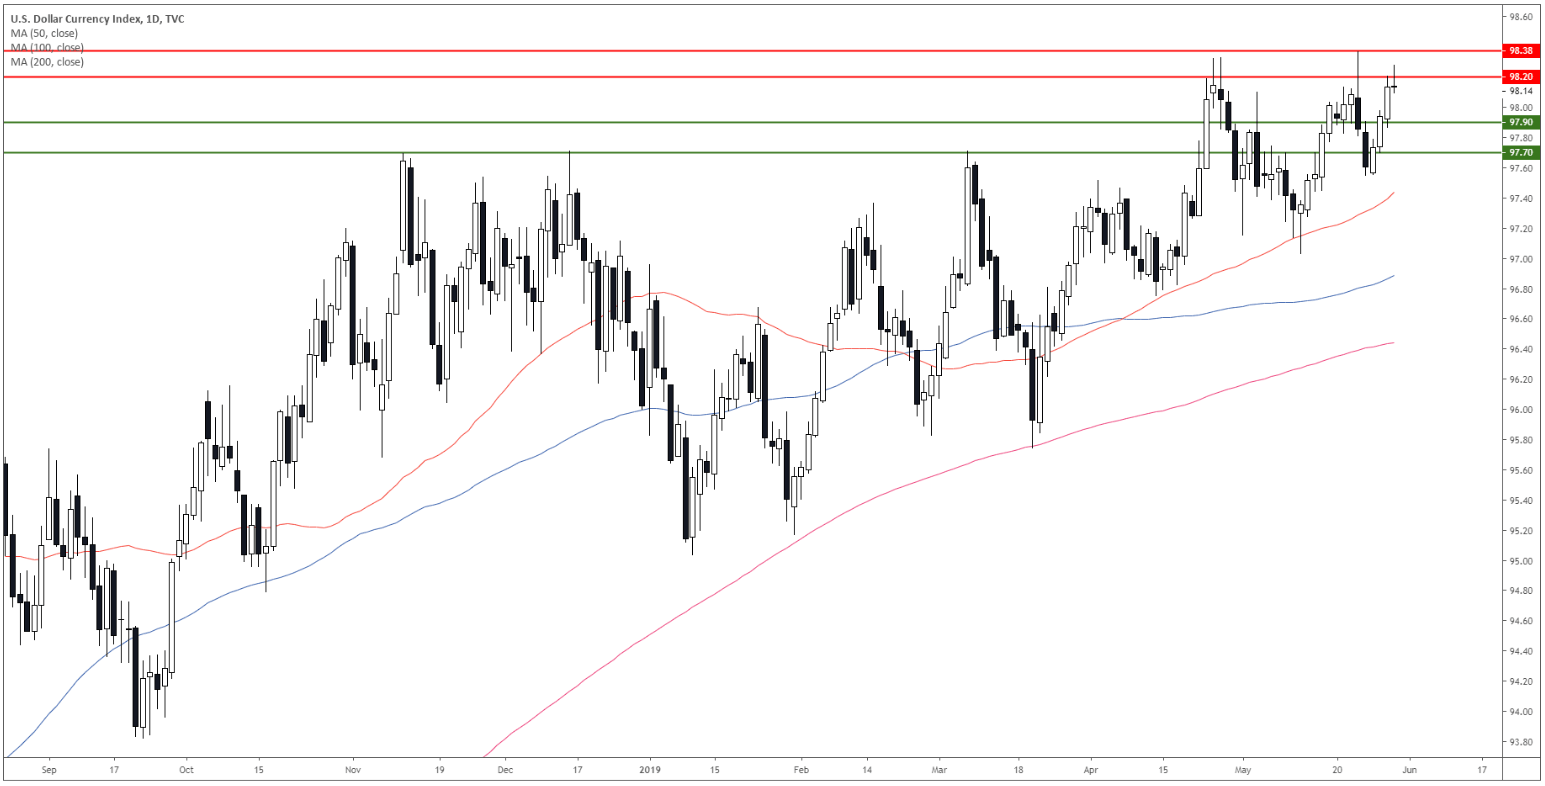
- DXY is very close to the 2019 high at 98.38.
DXY daily chart
The US Dollar Index (DXY) is in a bull trend above its main simple moving averages (SMAs). Bulls attempted to break above the 98.20 but DXY is ending the day virtually unchanged.

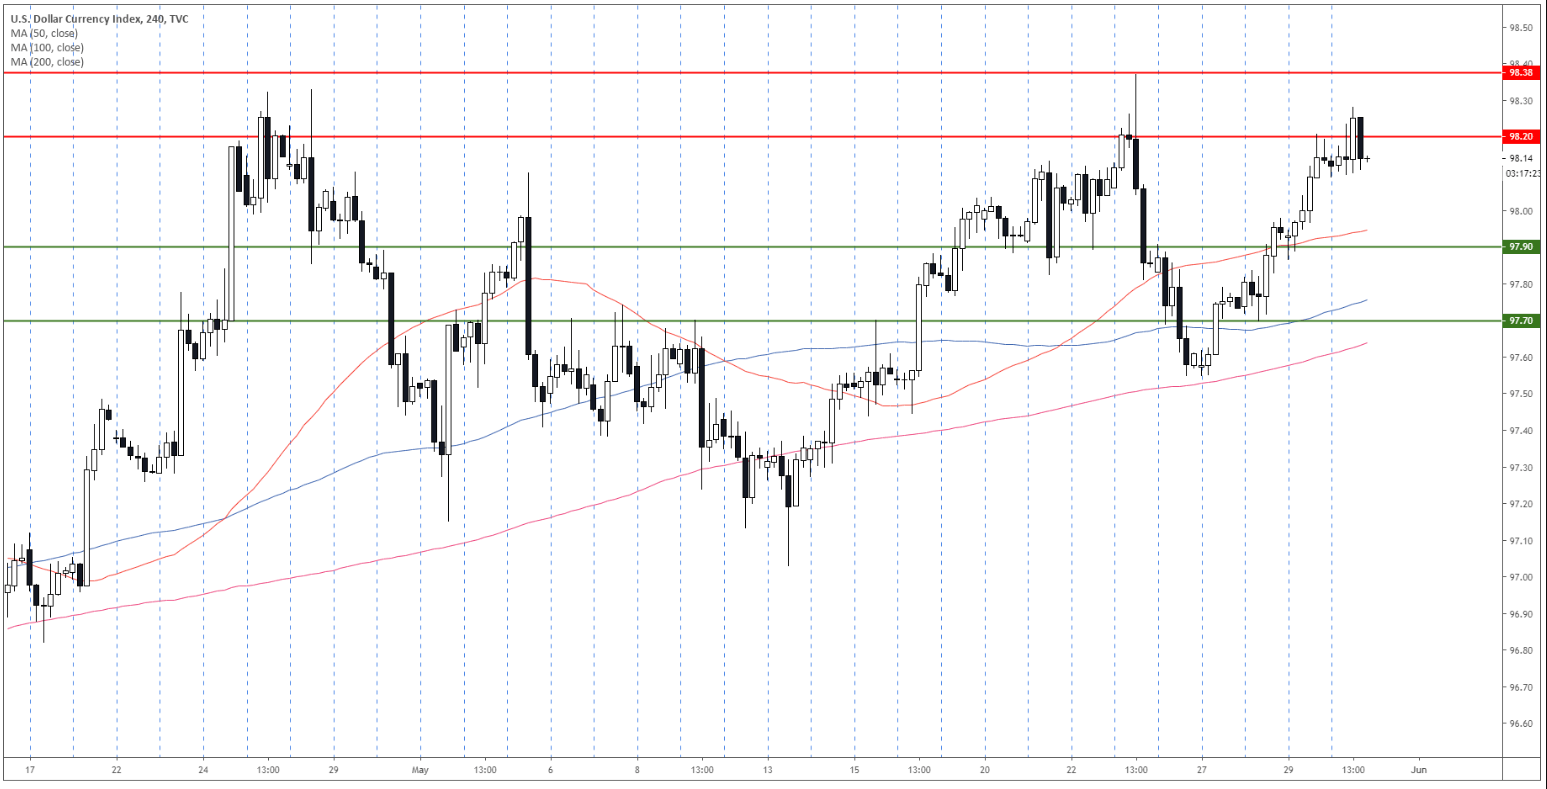
DXY 4-hour chart
The greenback is trading above its main SMAs suggesting a bullish bias in the medium term.

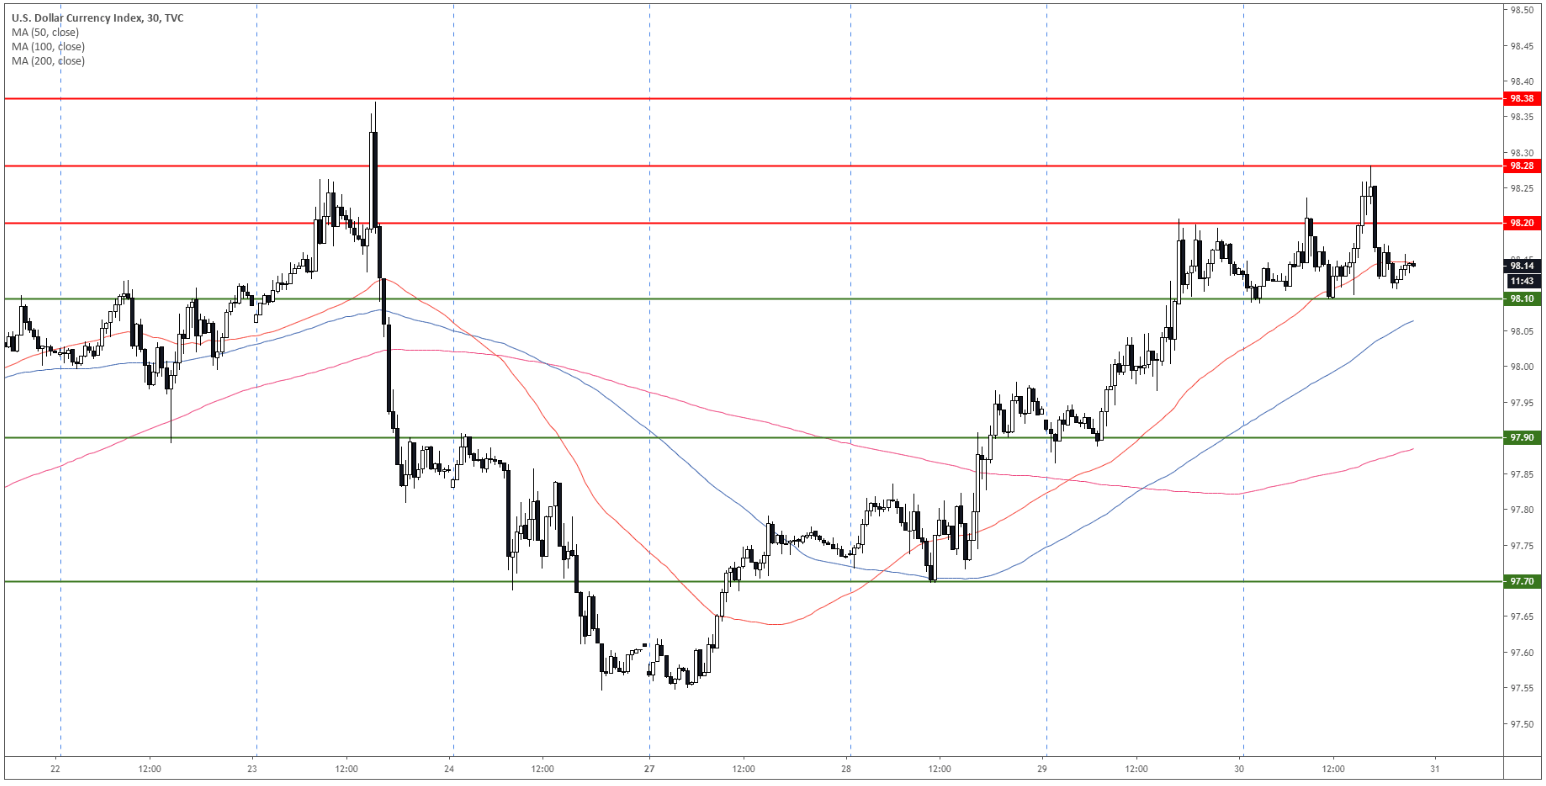
DXY 30-minute chart
The level to beat for bulls is 98.28 as the market is very close to the 2019 high at 98.38. However, a daily close below 98.10 can lead to a correction down to 97.90 and 97.70 support.

Additional key levels
