WTI technical analysis: Immediate resistance-line holds the gate for an upside to $64.75/80
- Nearly 2-week old trend-line questions energy buyers targeting recent highs.
- Latest bounce low around $60.30 could restrict near-term downside.
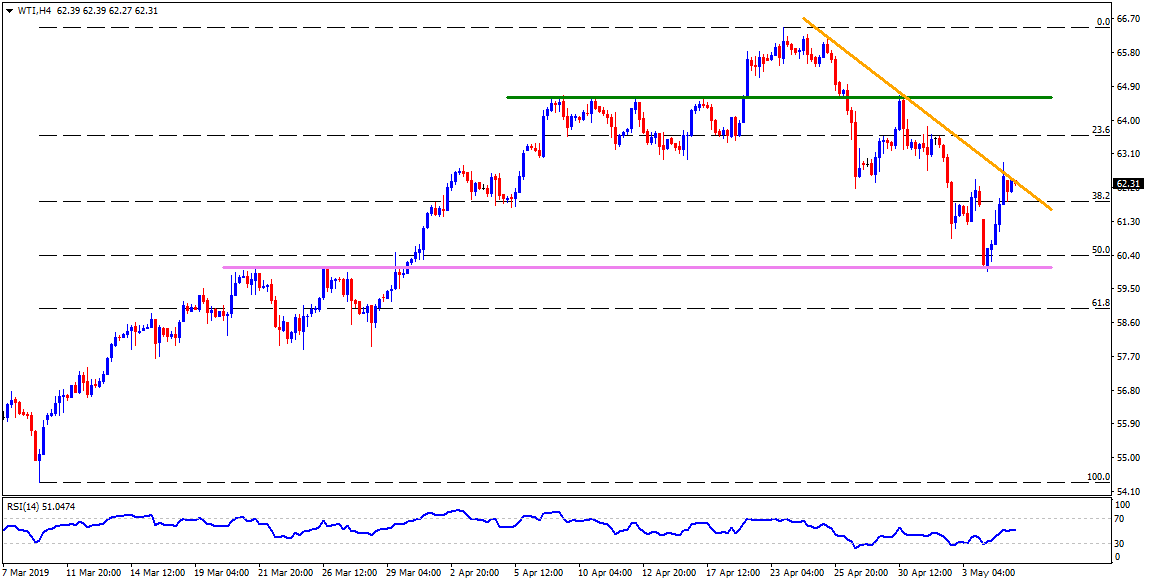
WTI is on the bids around $62.30 while heading into the Europe open on Tuesday. The black gold recently bounced off a horizontal-support and is nearing a fortnight old descending trend-line resistance.
If current optimism surrounding the energy benchmark help it cross the $62.40 resistance-line, it’s rise to 23.6% Fibonacci retracement of March – April advances at $63.70 can’t be denied.
However, multiple highs since early April could challenge the bulls around $64.75/80 past-$63.70, which if broken can recall $65.50 on the chart.
On the contrary, $62.00, $61.30 and aforementioned horizontal-support including highs since late-March and recent low, at $60.25/30, can please short-term sellers.
Should there be increased downside under $60.30, $60.00 round-figure and $58.10/58.00 area could flash on bears’ radar.
WTI 4-Hour chart
Trend: Positive