Back
18 Jan 2019
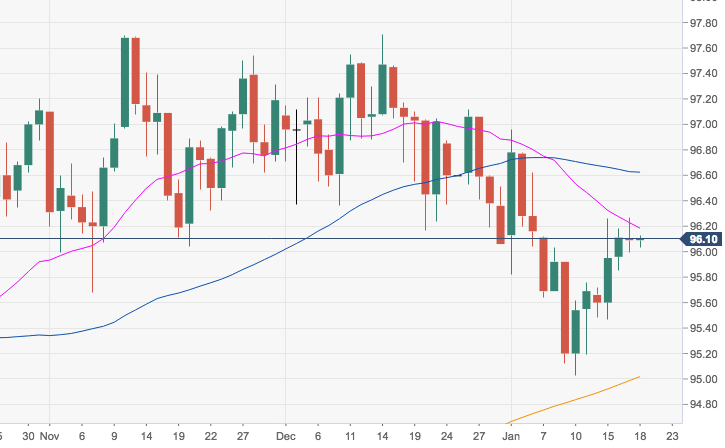
US Dollar Index Technical Analysis: The greenback still targets the 96.30 area and above
- The index is extending the rebound from last week’s lows and is once again facing important resistance in the 96.20/30 band.
- This area is supported by the 21-day SMA, today at 96.15, and the 38.2% Fibo retracement of the September-December up move, at 96.22.
- DXY has so far returned to the previous multi-week 95.70-97.70 range and extra gains should now retake the 96.60/80 band, where converge the 55-day SMA and another Fibo retracement.
DXY daily chart
Dollar Index Spot
Overview:
Today Last Price: 96.11
Today Daily change: 1 pips
Today Daily change %: 0.0208%
Today Daily Open: 96.09
Trends:
Daily SMA20: 96.19
Daily SMA50: 96.66
Daily SMA100: 96.05
Daily SMA200: 94.99
Levels:
Previous Daily High: 96.27
Previous Daily Low: 95.99
Previous Weekly High: 96.12
Previous Weekly Low: 95.03
Previous Monthly High: 97.71
Previous Monthly Low: 96.06
Daily Fibonacci 38.2%: 96.1
Daily Fibonacci 61.8%: 96.16
Daily Pivot Point S1: 95.96
Daily Pivot Point S2: 95.84
Daily Pivot Point S3: 95.68
Daily Pivot Point R1: 96.24
Daily Pivot Point R2: 96.4
Daily Pivot Point R3: 96.52