EUR/GBP Technical Analysis: Target hit as Euro drops to the 0.8970 level - Next destination is the 0.8900 figure
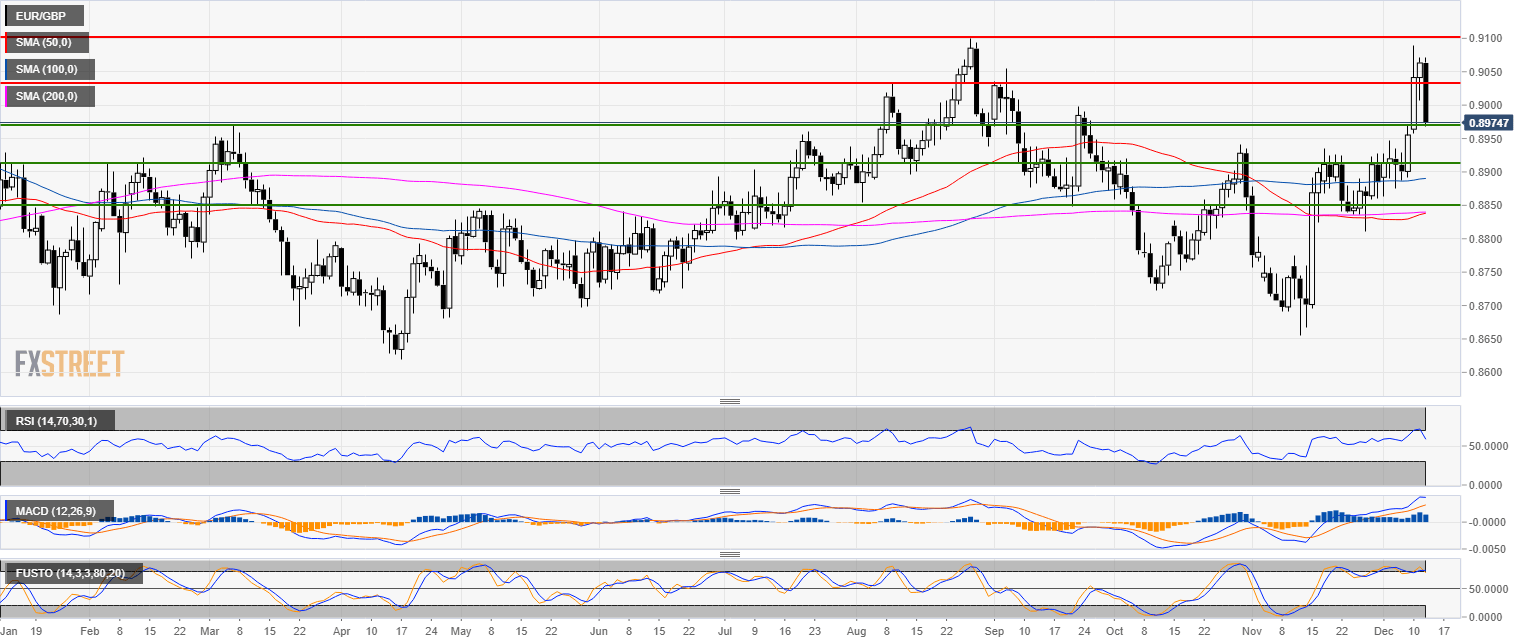
EUR/GBP daily chart
- EUR/GBP is trading in a bull trend above a flat 200-day simple moving average.
- As forecast, EUR/GBP dropped to the 0.8970 level.
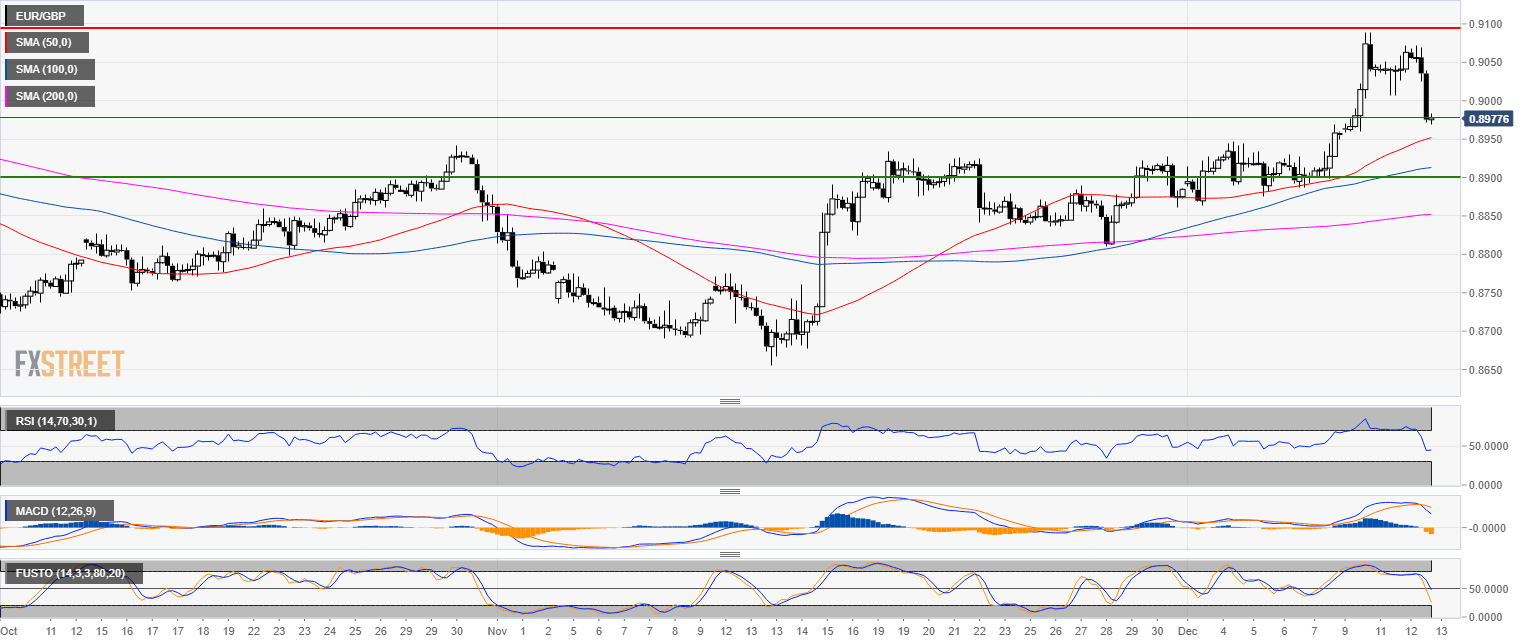
EUR/GBP 4-hour chart
- Euro is in correction mode after bulls bumped into a strong resistance at the 0.9100 figure.
- The correction might not be over just yet.
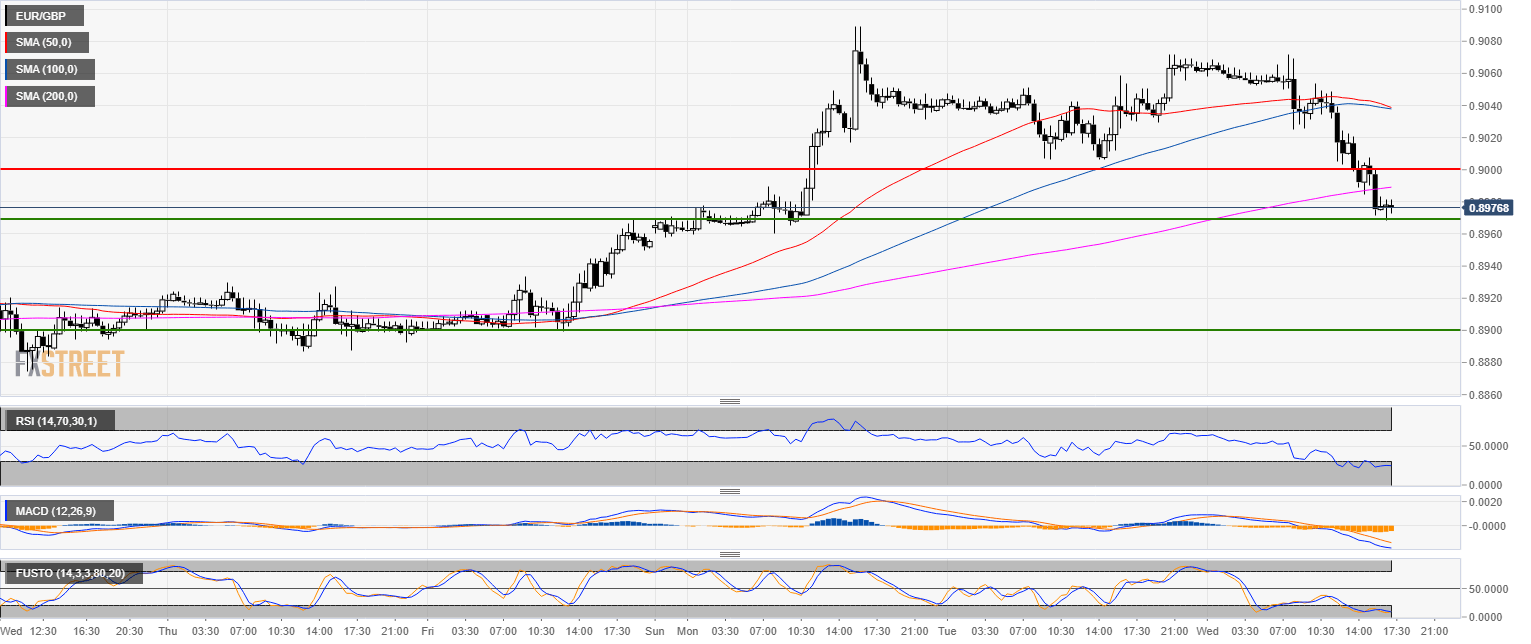
EUR/GBP 30-minute chart
- Resistance is 0.9000 figure.
- Traders can potentially expect a drop all the way to the 0.8900 figure as the 200 SMA has been broken to the downside.
Additional key levels
EUR/GBP
Overview:
Today Last Price: 0.8977
Today Daily change: -86 pips
Today Daily change %: -0.949%
Today Daily Open: 0.9063
Trends:
Previous Daily SMA20: 0.8898
Previous Daily SMA50: 0.8836
Previous Daily SMA100: 0.8889
Previous Daily SMA200: 0.884
Levels:
Previous Daily High: 0.907
Previous Daily Low: 0.9006
Previous Weekly High: 0.897
Previous Weekly Low: 0.8863
Previous Monthly High: 0.8932
Previous Monthly Low: 0.8656
Previous Daily Fibonacci 38.2%: 0.9045
Previous Daily Fibonacci 61.8%: 0.903
Previous Daily Pivot Point S1: 0.9023
Previous Daily Pivot Point S2: 0.8982
Previous Daily Pivot Point S3: 0.8959
Previous Daily Pivot Point R1: 0.9086
Previous Daily Pivot Point R2: 0.911
Previous Daily Pivot Point R3: 0.915