GBP/USD Technical Analysis: Cable reverses up as 1.2700 figure is back on the bulls radar
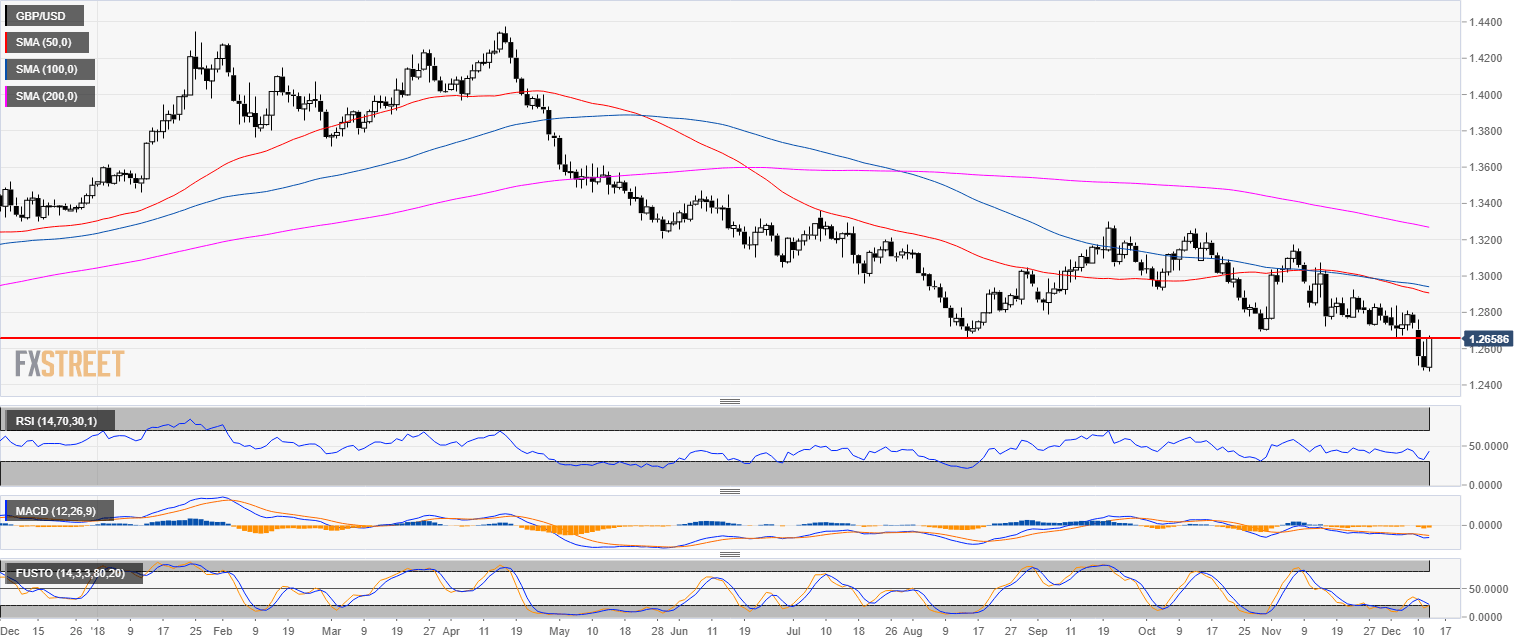
GBP/USD daily chart
- GBP/USD is trading in a bear trend below the 50, 100 and 200-day simple moving average (SMA).
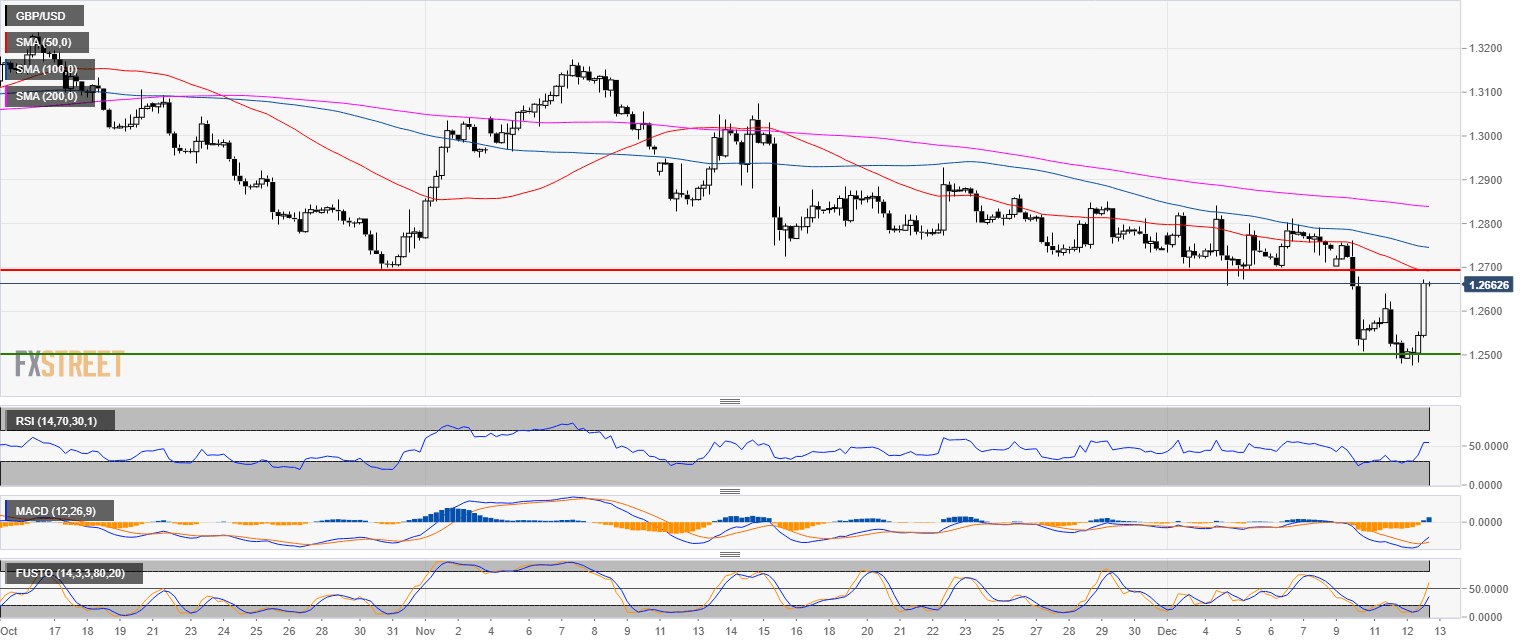
GBP/USD 4-hour chart
- GBP/USD rebounded from the 1.2500 figure as it is trading below its main SMAs.
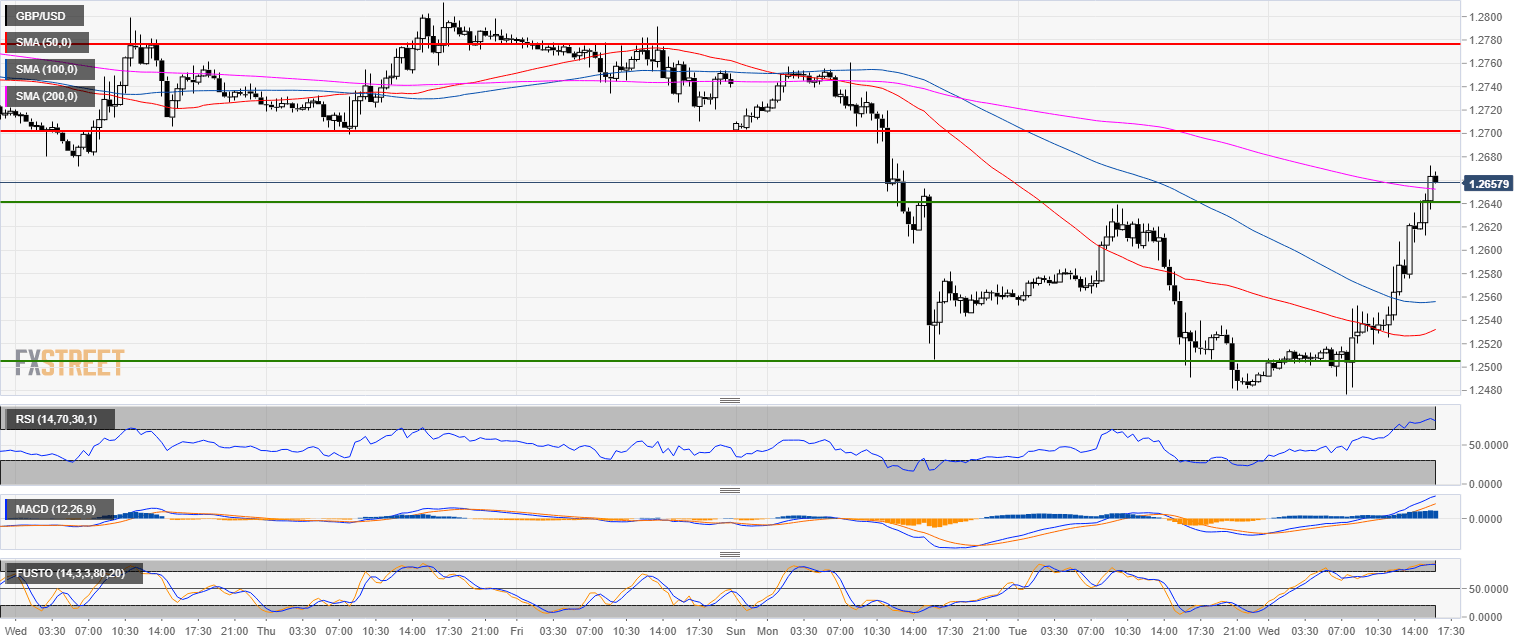
GBP/USD 30-minute chart
- GBP/USD broke above the 1.2640 resistance and the 200 SMA.
- The 1.2700 figure and 1.2775 become the next targets.
Additional key levels
GBP/USD
Overview:
Today Last Price: 1.2663
Today Daily change: 1.7e+2 pips
Today Daily change %: 1.33%
Today Daily Open: 1.2497
Trends:
Previous Daily SMA20: 1.2769
Previous Daily SMA50: 1.2913
Previous Daily SMA100: 1.2946
Previous Daily SMA200: 1.3275
Levels:
Previous Daily High: 1.2639
Previous Daily Low: 1.2481
Previous Weekly High: 1.284
Previous Weekly Low: 1.2659
Previous Monthly High: 1.3176
Previous Monthly Low: 1.2723
Previous Daily Fibonacci 38.2%: 1.2542
Previous Daily Fibonacci 61.8%: 1.2579
Previous Daily Pivot Point S1: 1.2439
Previous Daily Pivot Point S2: 1.2381
Previous Daily Pivot Point S3: 1.2281
Previous Daily Pivot Point R1: 1.2598
Previous Daily Pivot Point R2: 1.2698
Previous Daily Pivot Point R3: 1.2756