NZD/USD Price Analysis: Holds gains near 0.6200 ahead of US NFP
- NZD/USD clings to gains near 0.6200 ahead of US NFP report for May.
- The US Employment data will influence Fed rate-cut bets for September.
- The New Zealand Dollar strengthens amid speculation that the RBNZ will start reducing interest rates next year.
The NZD/USD pair trades inside Thursday’s trading range in Friday’s European session. The Kiwi asset clings to gains near the round-level resistance of 0.6200 amid hopes of interest rate differentials as the Reserve Bank of New Zealand (RBNZ) is expected to keep interest rates steady for the entire year while the Federal Reserve (Fed) is expected to deliver two rate cuts. Investors expect that the September meeting will be the earliest point from which the Fed will commence its policy normalization process.
The New Zealand Dollar has also capitalized on cheerful market mood. However, the market sentiment could become uncertain after the release of the United States (US) Nonfarm Payrolls (NFP) report for May, which will be published at 12:30 GMT. The US NFP report is expected to show that 185K fresh payrolls were added by employers, which were higher than the prior release of 185K.
Investors will also pay attention to the Average Hourly Earnings data for May, which exhibits the pace of the wage growth momentum. Annually, Average Hourly Earnings are estimated to have grown steadily by 3.9%. The US official Employment data that reflects country’s labor market health will significantly influence expectations for Fed interest-rate cuts in September.
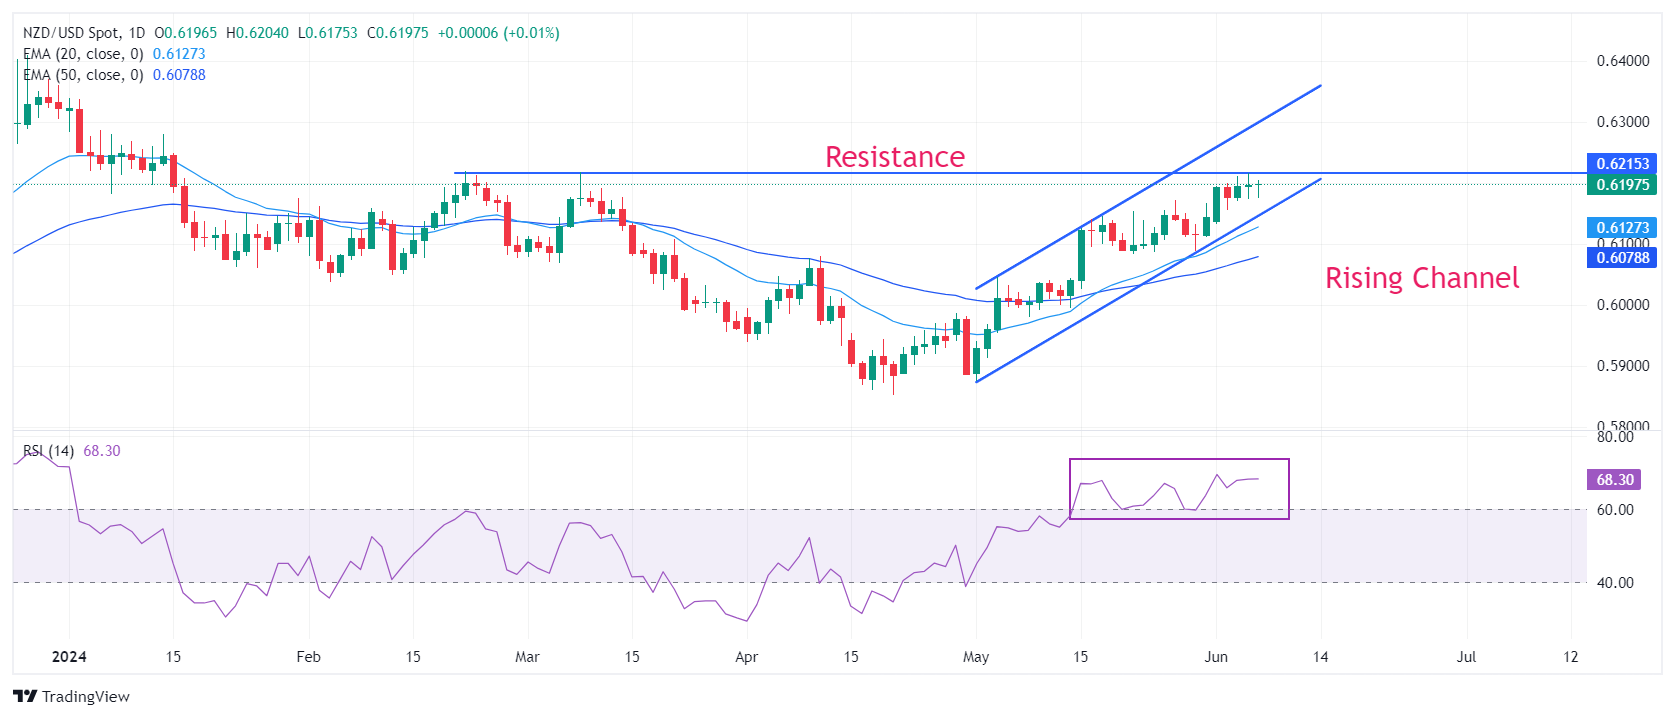
NZD/USD rises to the horizontal resistance plotted from February 22 high at 0.6219. The Kiwi asset trades in a Rising Channel chart pattern in which each pullback is considered as buying opportunity by market participants. Upward-sloping 20-and 50-day Exponential Moving Averages (EMAs) near 0.6127 and 0.6079, respectively, suggest that the overall trend is quite bullish.
The 14-period Relative Strength Index (RSI) oscillates in the bullish range of 60.00-80.00, which indicates that momentum has leaned towards the upside.
An upside move above June 6 high at 0.6216 will drive the asset January 15 high near 0.6250, followed by January 12 high near 0.6280.
On the contrary, fresh downside would appear if the asset breaks below April 4 high around 0.6050. This would drag the asset towards the psychological support of 0.6000 and April 25 high at 0.5969.
NZD/USD daily chart