Gold Price Forecast: XAU/JUSD struggles to find direction as focus shifts to Fed policy
- Gold price is inside the woods as investors are awaiting the Fed policy announcement for further guidance.
- The USD Index slipped firmly from 102.17 despite the upbeat Employment Cost Index and consistency in consumer spending.
- Lengthy consolidation in the Gold price would be followed by wider ticks and heavy volume after an explosion
Gold price (XAU/USD) is hovering around $1,990.00 in the early Asian session. The precious metal is struggling to find any direction as investors are awaiting the announcement of the interest rate decision by the Federal Reserve (Fed). The yellow metal is bounded in a range of $1,970-2,010 from the past week as investors are anxious about knowing the importance of May’s monetary policy meeting.
S&P500 settled last week with 1% gains despite a sell-off in the initial days. After digesting renewed fears of United States banking woes investors shifted their focus on upbeat quarterly earnings from technology stocks. Also, Friday’s bullish closing portrays an upbeat market mood.
The US Dollar Index (DXY) slipped firmly from the weekly high of 102.17 on Friday despite an upbeat Employment Cost Index and consistency in consumer spending. The Labor Cost Index (Q1) jumped to 1.2% from the consensus and the former release of 1.1%. A higher labor cost index indicates that firms still offer higher wages to attract talent due to labor shortage.
Meanwhile, the monthly core Personal Consumption Expenditure (PCE) Price Index remained consistent with estimates and former acceleration at 0.3%. The preferred tool of the Fed to judge the overall context of inflationary pressures in the US economy landed at 4.6% higher than expectations of 4.5% but lower than the former release of 4.7% on an annual basis, indicating stubbornness in core inflation.
Gold technical analysis
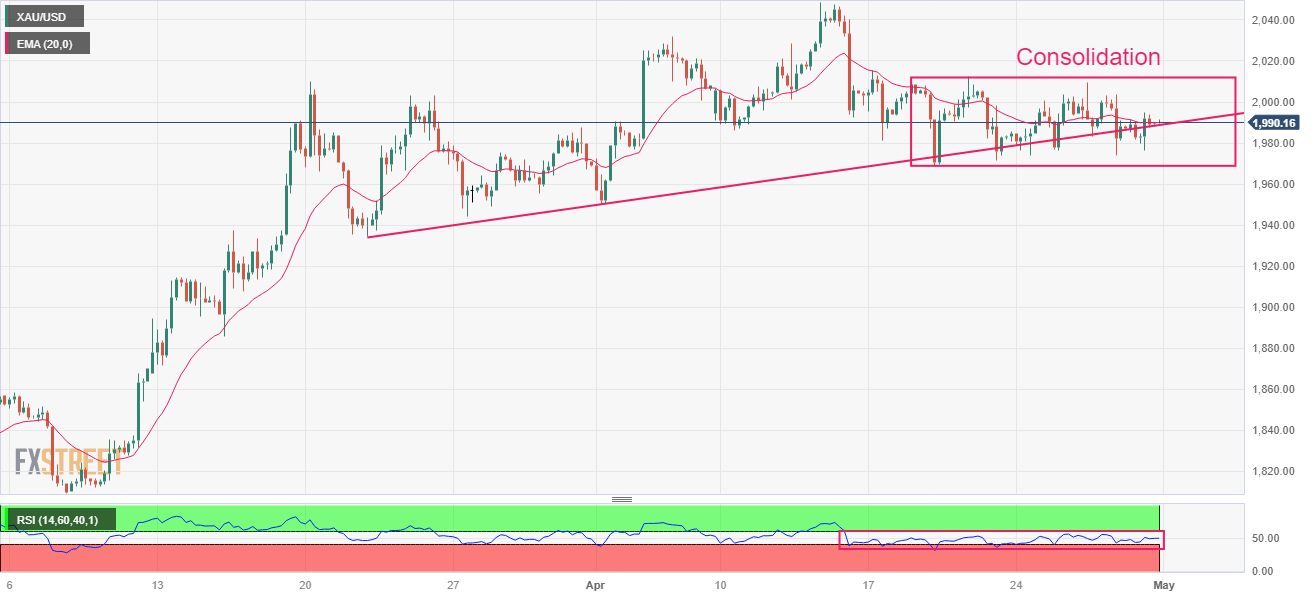
Gold price is inside the woods from the past week in a range of $1,969-2,014 on a four-hour scale. Lengthy consolidation indicates a sheer volatility contraction, which is expected to be followed by wider ticks and heavy volume after an explosion.
Advancing trendline from March 22 low at $1,934.34 is acting as a cushion for the Gold bulls.
The 20-period Exponential Moving Average (EMA) at $1,990.15 is continuously hovering around the Gold price, hinting at a sideways performance.
Also, the Relative Strength Index (RSI) (14) is oscillating in the 40.00-60.00 range, indicating an absence of a critical trigger.
Gold four-hour chart