Gold Price Forecast: XAU/USD approaches $2,000 amid downbeat United States Treasury bond yields, US Dollar
- Gold price extends week-start recovery from a short-term key support line, renews intraday high of late.
- United States Treasury bond yields, US Dollar decline amid debt ceiling drama.
- XAU/USD market also seems to brace for dovish Federal Reserve, downbeat US Gross Domestic Product (GDP).
- US CB Consumer Confidence can direct intraday moves, risk catalysts are the key.
Gold price (XAU/USD) picks up bids to refresh intraday high near $1,996 as it stretches the previous day’s rebound from a five-week-old ascending support line during early Tuesday. In doing so, the bright metal cheers downbeat United States Treasury bond yields and the US Dollar as markets prepare for the key US Gross Domestic Product and the Federal Reserve (Fed) outcomes. Also weighing on the US bond coupons and the greenback are concerns surrounding the US debt ceiling which is likely to expire in June.
Gold price rebounds as United States Treasury bond yields weigh on US Dollar
Gold price marches amid fears that the United States is reaching its debt limit expiration in June. A political drama ahead of that keeps traders on their toes and push them towards the risk-safety, which in turn propelled the demand for one-month US Treasury bond yields. On the same line, are the clues that the US Federal Reserve (Fed) could announce one last rate hike, worth 0.25%, in May before signaling the policy pivot.
With this, the difference between one-month and three-month US Treasury bond yields widen the most since 2001. As a result, the US Dollar Index (DXY) remains depressed near 101.30 as it drops for the fourth consecutive day.
Downbeat United States data also favors XAU/USD buyers
Apart from the concerns surrounding the US debt ceiling and the Fed, recently softer US data also weigh on the US Dollar and allow the XAU/USD to remain firmer. That said, the Federal Reserve Bank of Chicago's National Activity Index (CFNAI) remained unchanged at -0.19 versus -0.02 expected. However, the publication added that the index’s three-month moving average, CFNAI-MA3, increased to +0.01 in March from –0.09 in February. On the other hand, Dallas Fed Manufacturing Business Index for the said month dropped to 23.4 for April versus -14.6 expected and -15.7 prior.
It’s worth noting, however, that the geopolitical fears surrounding Russia and China joins the market’s cautious mood ahead of this week’s top-tier growth and inflation data to prod the Gold buyers. That said, hopes of gradual economic recovery and an upbeat earnings season allow the US Dollar buyers to stay hopeful. Furthermore, geopolitical fears surrounding Russia, due to China’s alleged support to Moscow in fighting with Ukraine, as well as amid the Western readiness to increase sanctions on the Oil-rich nation, prod the market’s cautious optimism and put a floor under the US Dollar price.
Looking forward, US Conference Board’s (CB) Consumer Confidence gauge for April, expected to remain steady near 104.1 versus 104.2 prior, will be important for the intraday directions of the DXY. However, major attention will be given to US Q1 GDP, US Core PCE Price Index and the yields for a clear guide.
Gold price technical analysis
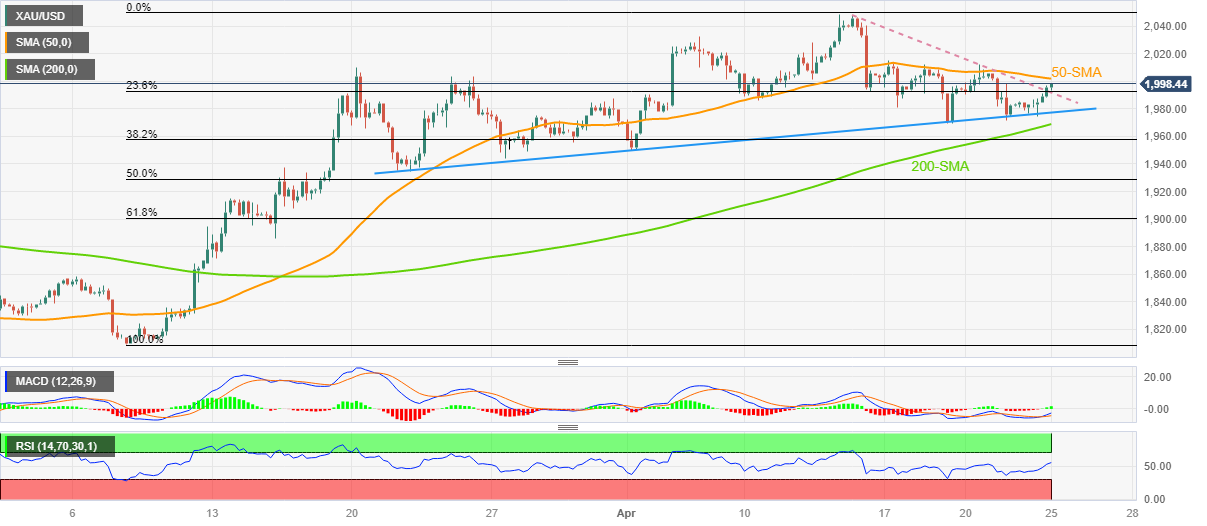
Gold price pierces one-week-old descending resistance line as it approaches the 50-bar Simple Moving Average (SMA) of around $2,003 amid bullish signals from the Moving Average Convergence and Divergence (MACD) indicator. Also favoring the XAU/USD buyers is the steady Relative Strength Index (RSI) line, placed at 14.
With this, the bullion appears well set for further upside and can well aim for the monthly high of around $2,049.
On the contrary, Gold sellers need validation from a five-week-old ascending support line, around $1,980 by the press time, to retake controls.
Following that, the 200-bar SMA level of around $1,966 and the late March low surrounding $1,935 may gain the XAU/USD bear’s attention.
It’s worth noting that the XAU/USD weakness past $1,935 can quickly drag the quote towards the 61.8% Fibonacci retracement of its March-April upside, near the $1,900 threshold.
Gold price: Four-hour chart
Trend: Limited upside expected