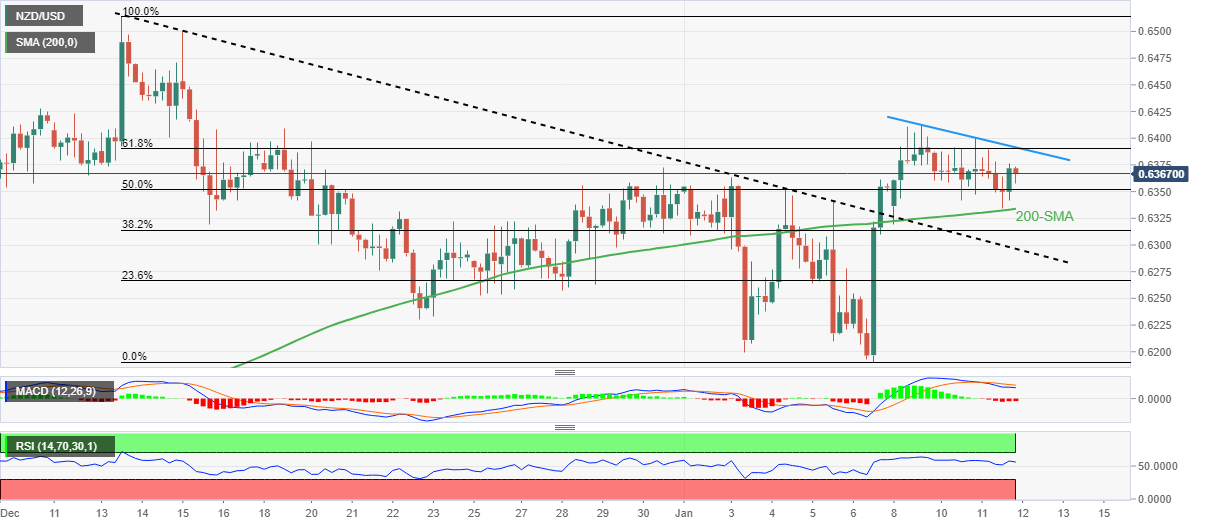
NZD/USD Price Analysis: Fades bounce off 200-SMA below 0.6390 resistance confluence
- NZD/USD struggles to defend weekly gains despite keeping recent technical breakouts.
- Convergence of weekly resistance line, 61.8% Fibonacci retracement level guards immediate upside amid bearish MACD signals.
- Sustained trading beyond 200-SMA, previous resistance line from early December keeps buyers hopeful.
NZD/USD retreats to 0.6370 as bulls take a breather ahead of the key inflation data from China and the US on early Thursday.
In doing so, the Kiwi pair fades the previous day’s bounce off the 200-Simple Moving Average (SMA). Also adding strength to the pullback moves could be the bearish MACD signals.
Even so, the NZD/USD buyers defend Friday’s upside break of the one-month-old descending resistance line, now support, as well as the 200-SMA. On the same line is the firmer RSI (14) line, not overbought.
Hence, the NZD/USD price is likely to struggle despite keeping the latest bullish signals.
That said, a convergence of the weekly descending trend line joins the 61.8% Fibonacci retracement level of the pair’s December-January downturn, around 0.6390, appears a tough nut to crack for the NZD/USD bulls.
Following that, the monthly high around 0.6415 appears additional upside filter for the quote to cross to justify the traders’ bullish bias.
In a case where the NZD/USD remains firmer past 0.6415, the odds of witnessing a run-up toward the previous monthly peak of 0.6514 can’t be ruled out.
Meanwhile, the 200-SMA and the aforementioned resistance-turned-support line, close to 0.6335 and 0.6295 in that order, restrict the short-term downside of the NZD/USD pair.
If the Kiwi pair sellers keep the reins past 0.6295, the recent hopes of witnessing a north-run take a backseat as prices could challenge the monthly low of 0.6190.
NZD/USD: Four-hour chart

Trend: Pullback expected
