Gold Price Forecast: XAU/USD remains bearish ahead of US inflation – Confluence Detector
- Gold price fades recovery from weekly low as multiple hurdles challenge XAU/USD bulls.
- Pre-even anxiety restricts immediate moves but hawkish Fed bets keep bears hopeful.
- US CPI could push the metal towards breaking $1,660 support convergence.
Gold price (XAU/USD) takes offers to renew intraday low as it reverses the previous day’s bounce off weekly low ahead of the key US Consumer Price Index (CPI). The metal’s latest weakness could be linked to the hawkish bias over the Fed’s next move, especially after the latest Federal Open Market Committee (FOMC) Meeting Minutes. Also exerting downside pressure on the bullion are the headlines surrounding China as the US escalates hardships for the chipmakers and Shanghai/Hong Kong hardens virus-led lockdowns. Alternatively, the pre-CPI trading lull joins China’s stimulus, via the housing market intervention, to restrict the XAU/USD downside.
That said, the recently firmer yields and hawkish Fed bets keep the bullion sellers hopeful amid hopes of fierce inflation woes ahead.
Also read: Gold Price Forecast: XAU/USD rebound appears lucrative above $1,660, US inflation in focus
Gold Price: Key levels to watch
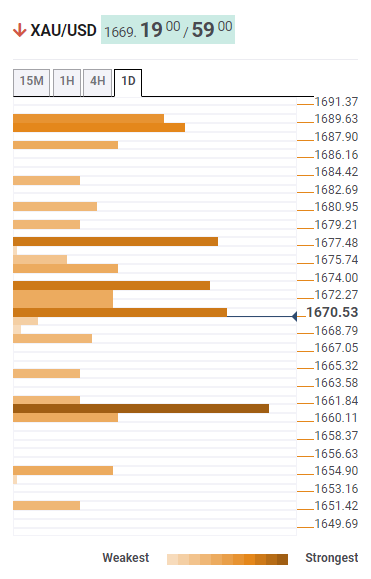
The Technical Confluence Detector shows that the gold price has a smooth run towards the $1,660 key support that comprises the pivot point one-week S1, the previous day’s low and Fibonacci 38.2% one-month.
Minor support around $1,655 could then test the bear’s commitments as the support encompasses pivot point one-day S2 and the lower band of the Bollinger on 4H.
It’s worth noting that the metal’s weakness past $1,655 may not hesitate to challenge the yearly low of $1,615.
Alternatively, a convergence of the middle Bollinger and SMA100 on 4H guards immediate XAU/USD recovery near $1,674.
Following that, the previous yearly low near $1,678 holds the key to the gold price run-up towards the $1,690 hurdle including 10-DMA, pivot point one-day R2 and SMA200 on 4H.
Overall, gold price remains well below the key resistances and has a smooth run towards the south.
Here is how it looks on the tool
About Technical Confluences Detector
The TCD (Technical Confluences Detector) is a tool to locate and point out those price levels where there is a congestion of indicators, moving averages, Fibonacci levels, Pivot Points, etc. If you are a short-term trader, you will find entry points for counter-trend strategies and hunt a few points at a time. If you are a medium-to-long-term trader, this tool will allow you to know in advance the price levels where a medium-to-long-term trend may stop and rest, where to unwind positions, or where to increase your position size.