GBP/USD Price Analysis: Bears stay the course despite break of trendline resistance
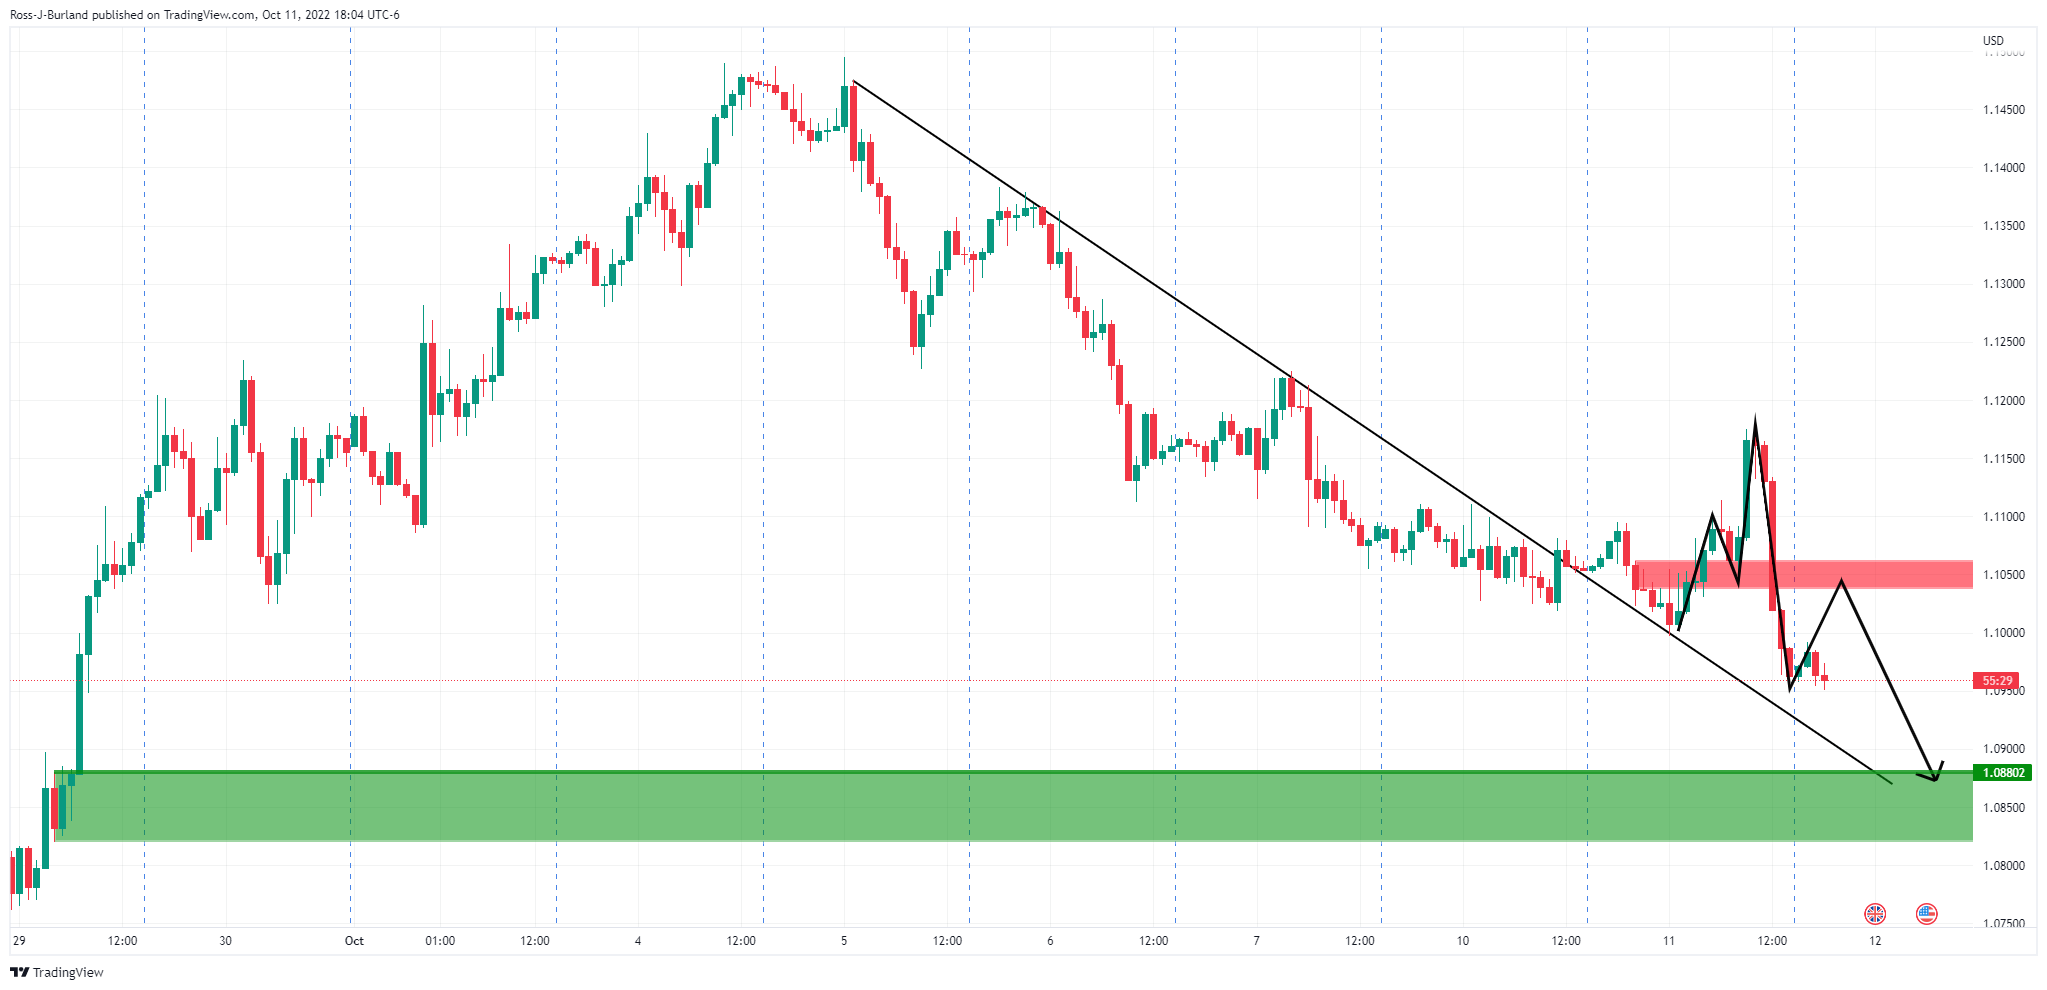
GBP/USD is shedding some ground in Asia and is on the back foot in the Tokyo open. The pair has fallen from a high of 1.0992 and has printed a low of 1.0950 so far. Cable has attempted a recovery, scoring a high near 1.1180 on the move out of the prior trendline resistance that now acts as counter-trendline support as illustrated on the hourly charts below:
GBP/USD H1 chart

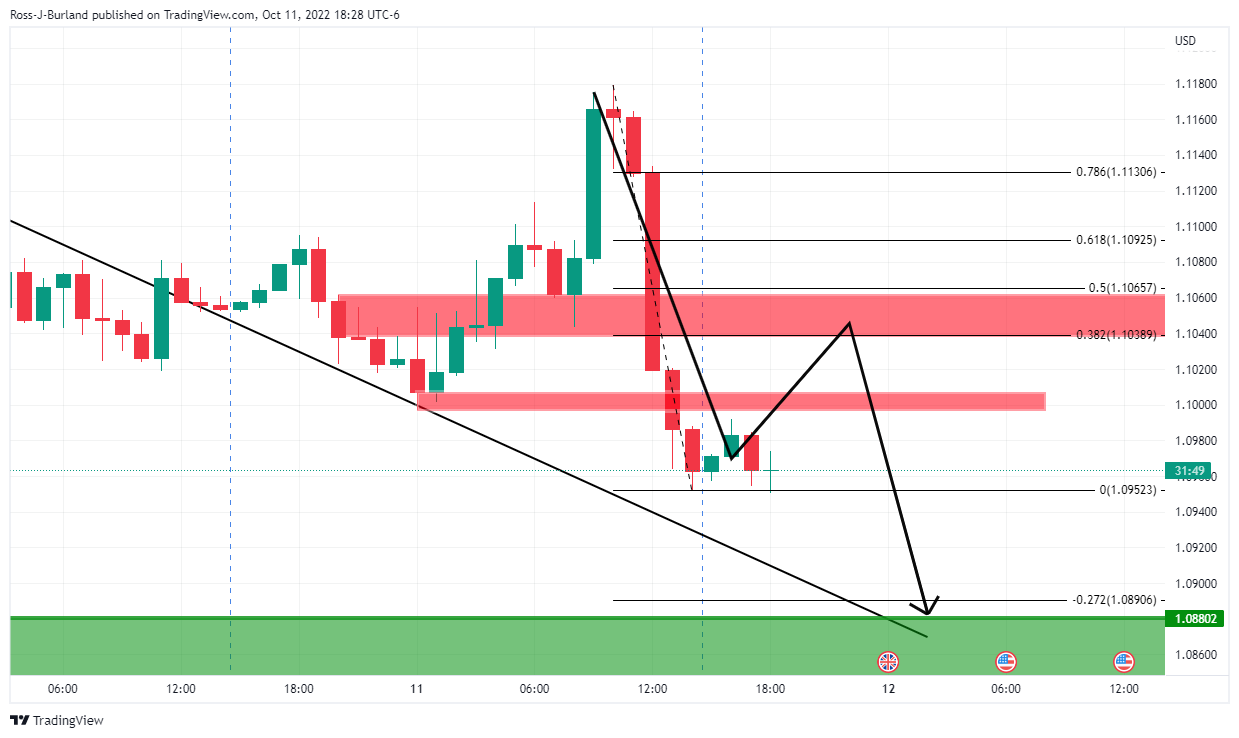
The M-formation is a reversion pattern which is a reversion pattern that might be expected to see the price correct higher in the coming hours, potentially into the neckline that meets a 38.2% Fibonacci retracement level:

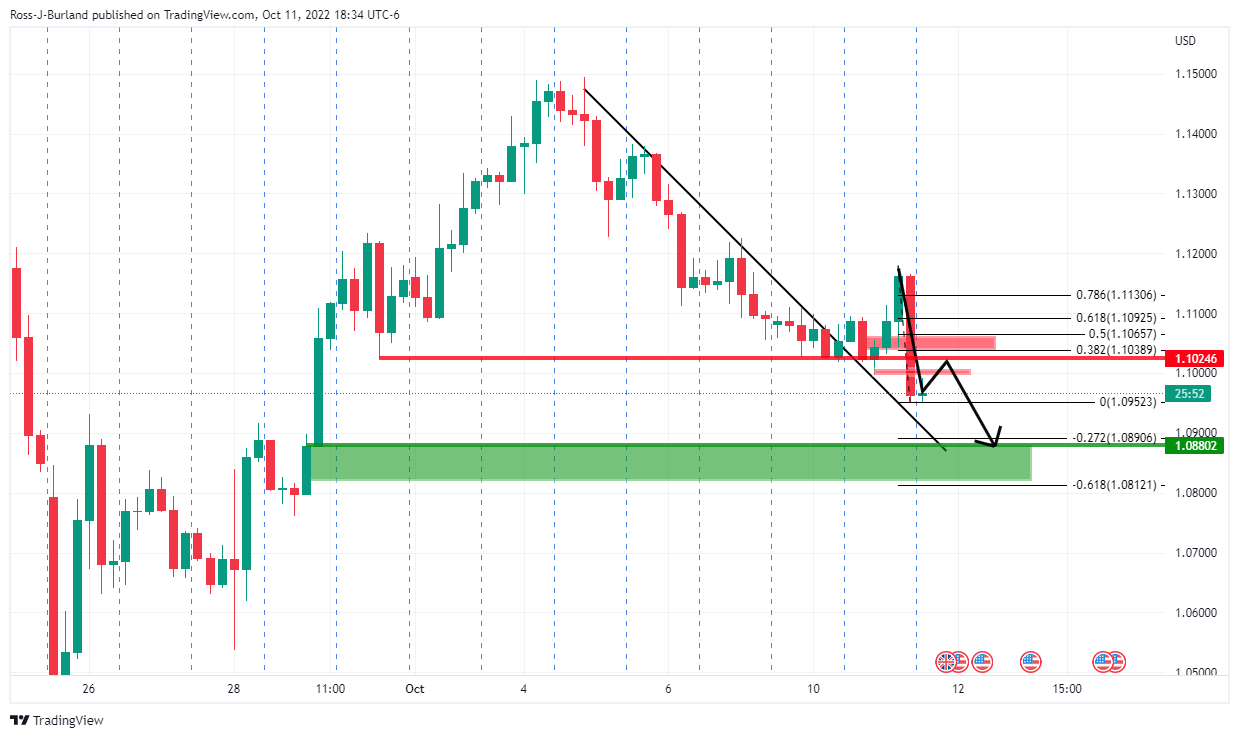
GBP/USD H4 chart

Meanwhile, as for the structure on the four-hour chart, the neckline of the M0formation aligns with prior support dating back to September 30 that reinforces the prospects for there being potential resistance here.
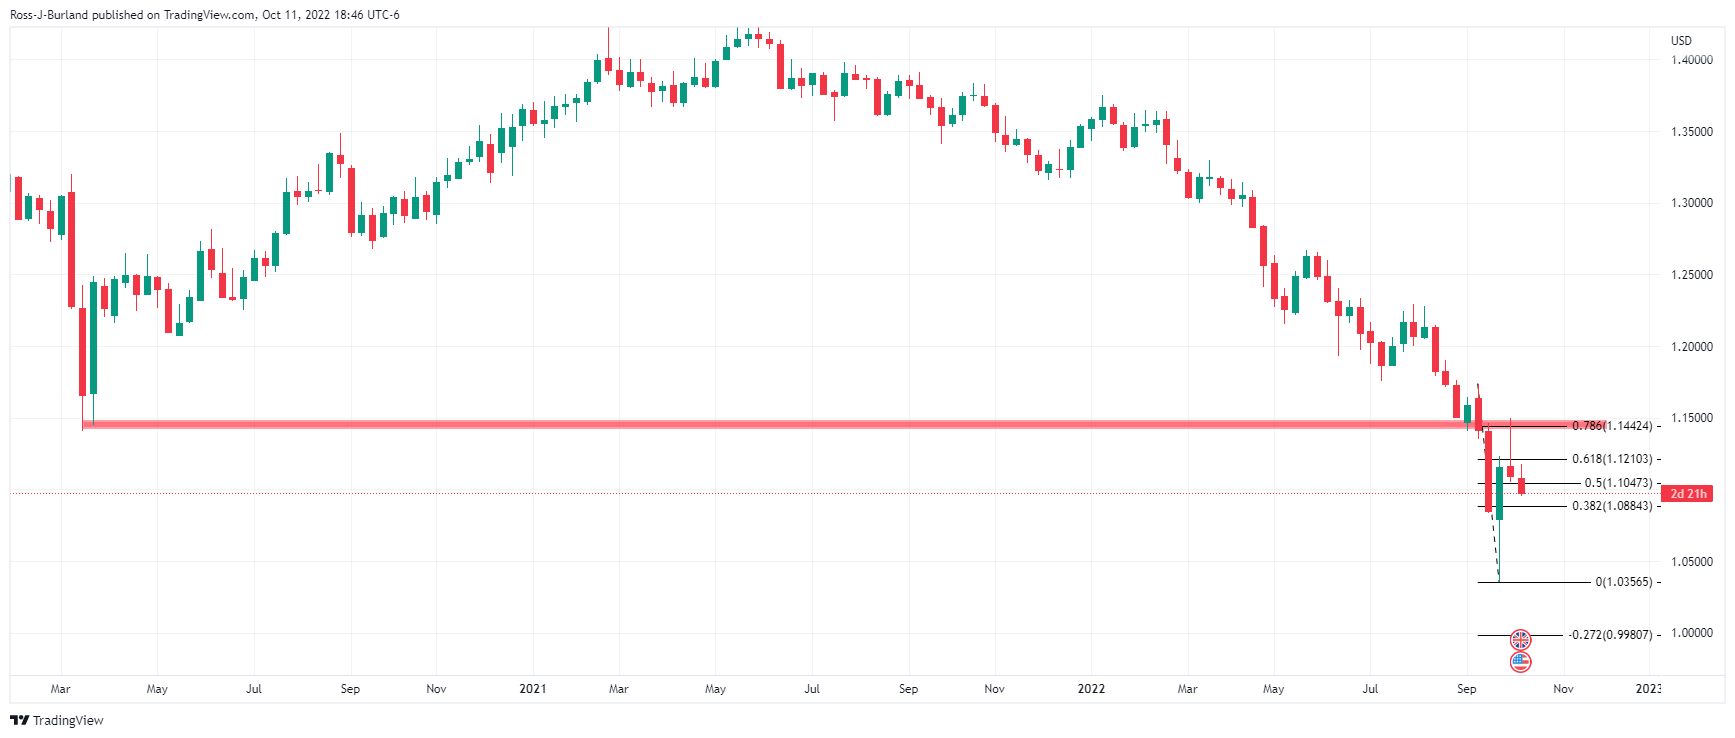
GBP/USD weekly chart

The price remains bearish below 1.1500 following the test of the weekly 78.6% Fibo'.
